Seller's Discretionary Earnings vs EBITDA for Small Business Valuation
SDE and EBITDA answer different questions about what your business is actually worth.

If you have ever sat across the table from a buyer who seemed confused about why you valued your business the way you did, there is a good chance the two of you were speaking different languages without realizing it. Not different opinions about growth prospects or risk tolerance. Different foundational metrics, each encoding entirely different assumptions about what kind of business was actually being sold. I have been in that room more times than I can count, and the confusion is almost never about the math. It is about which question the math is being asked to answer.
Seller's Discretionary Earnings and EBITDA are not competing valuation methodologies, the way some sellers assume. They are instruments calibrated for different purposes, the way a thermometer and a barometer are both measuring instruments but are not interchangeable. Understanding which one applies to your business is not a technical footnote; it is the prerequisite to every other conversation about what your company is worth.
Both metrics start from the same place: net income, with taxes, interest, depreciation, and amortization added back. That is where the similarity ends. The fork is how each metric treats the owner's compensation.
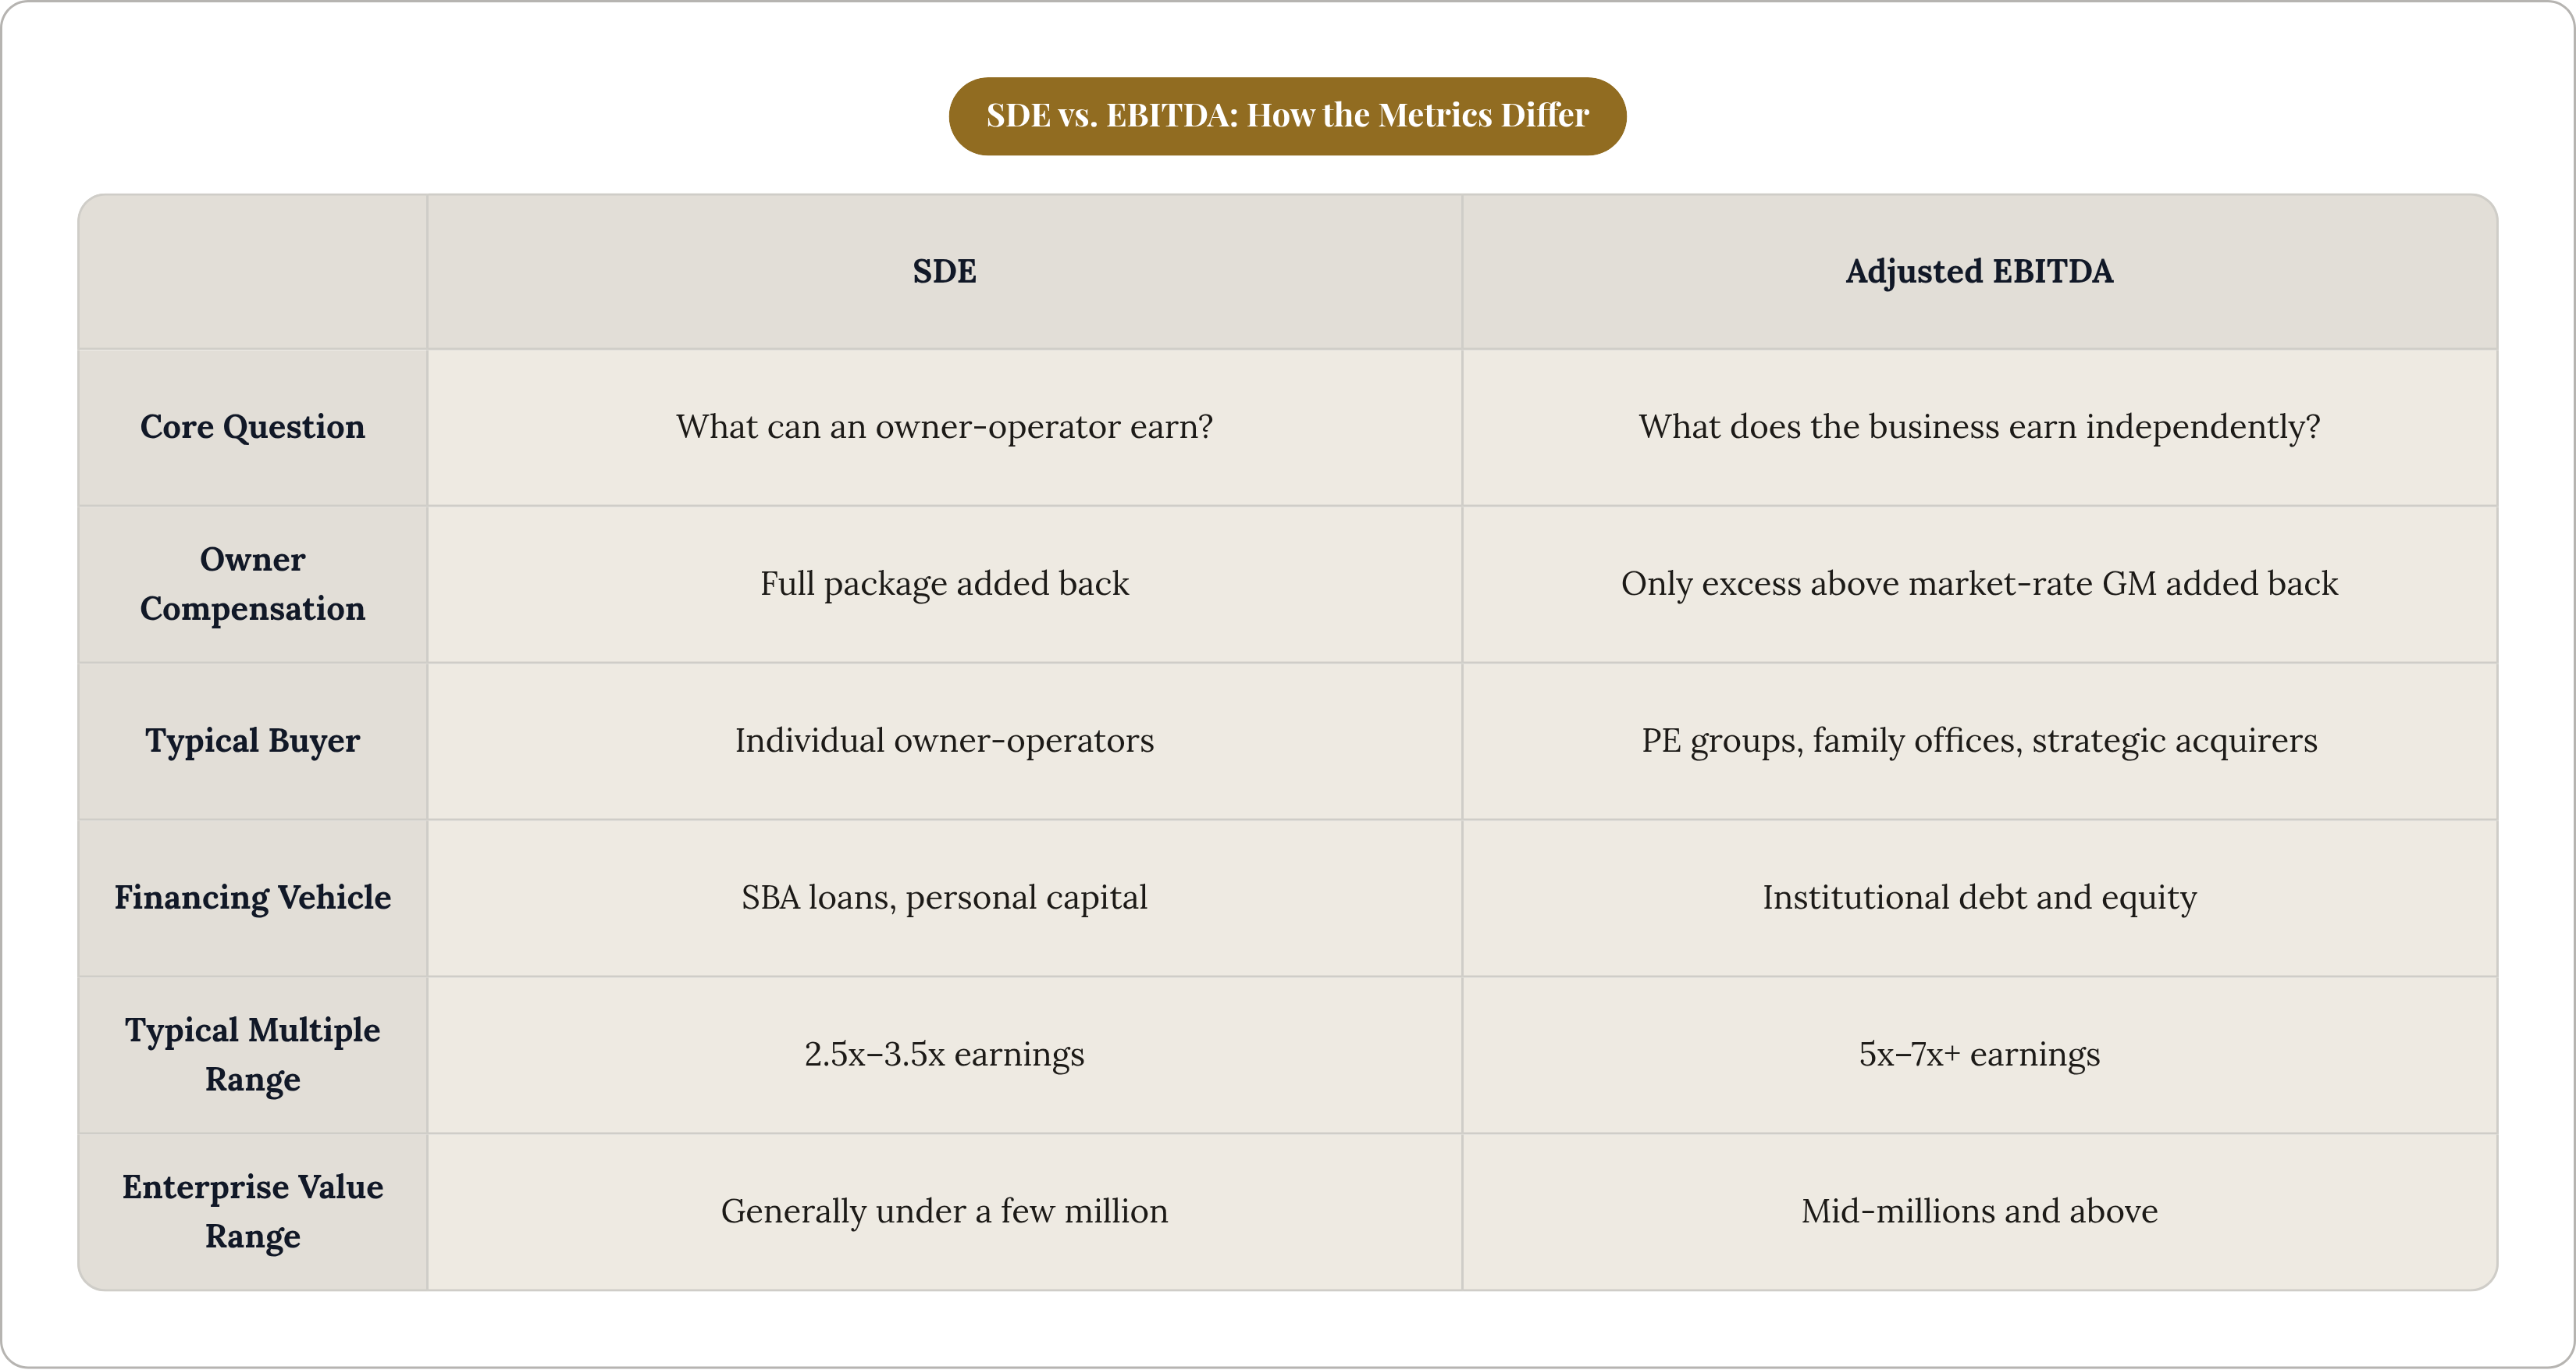
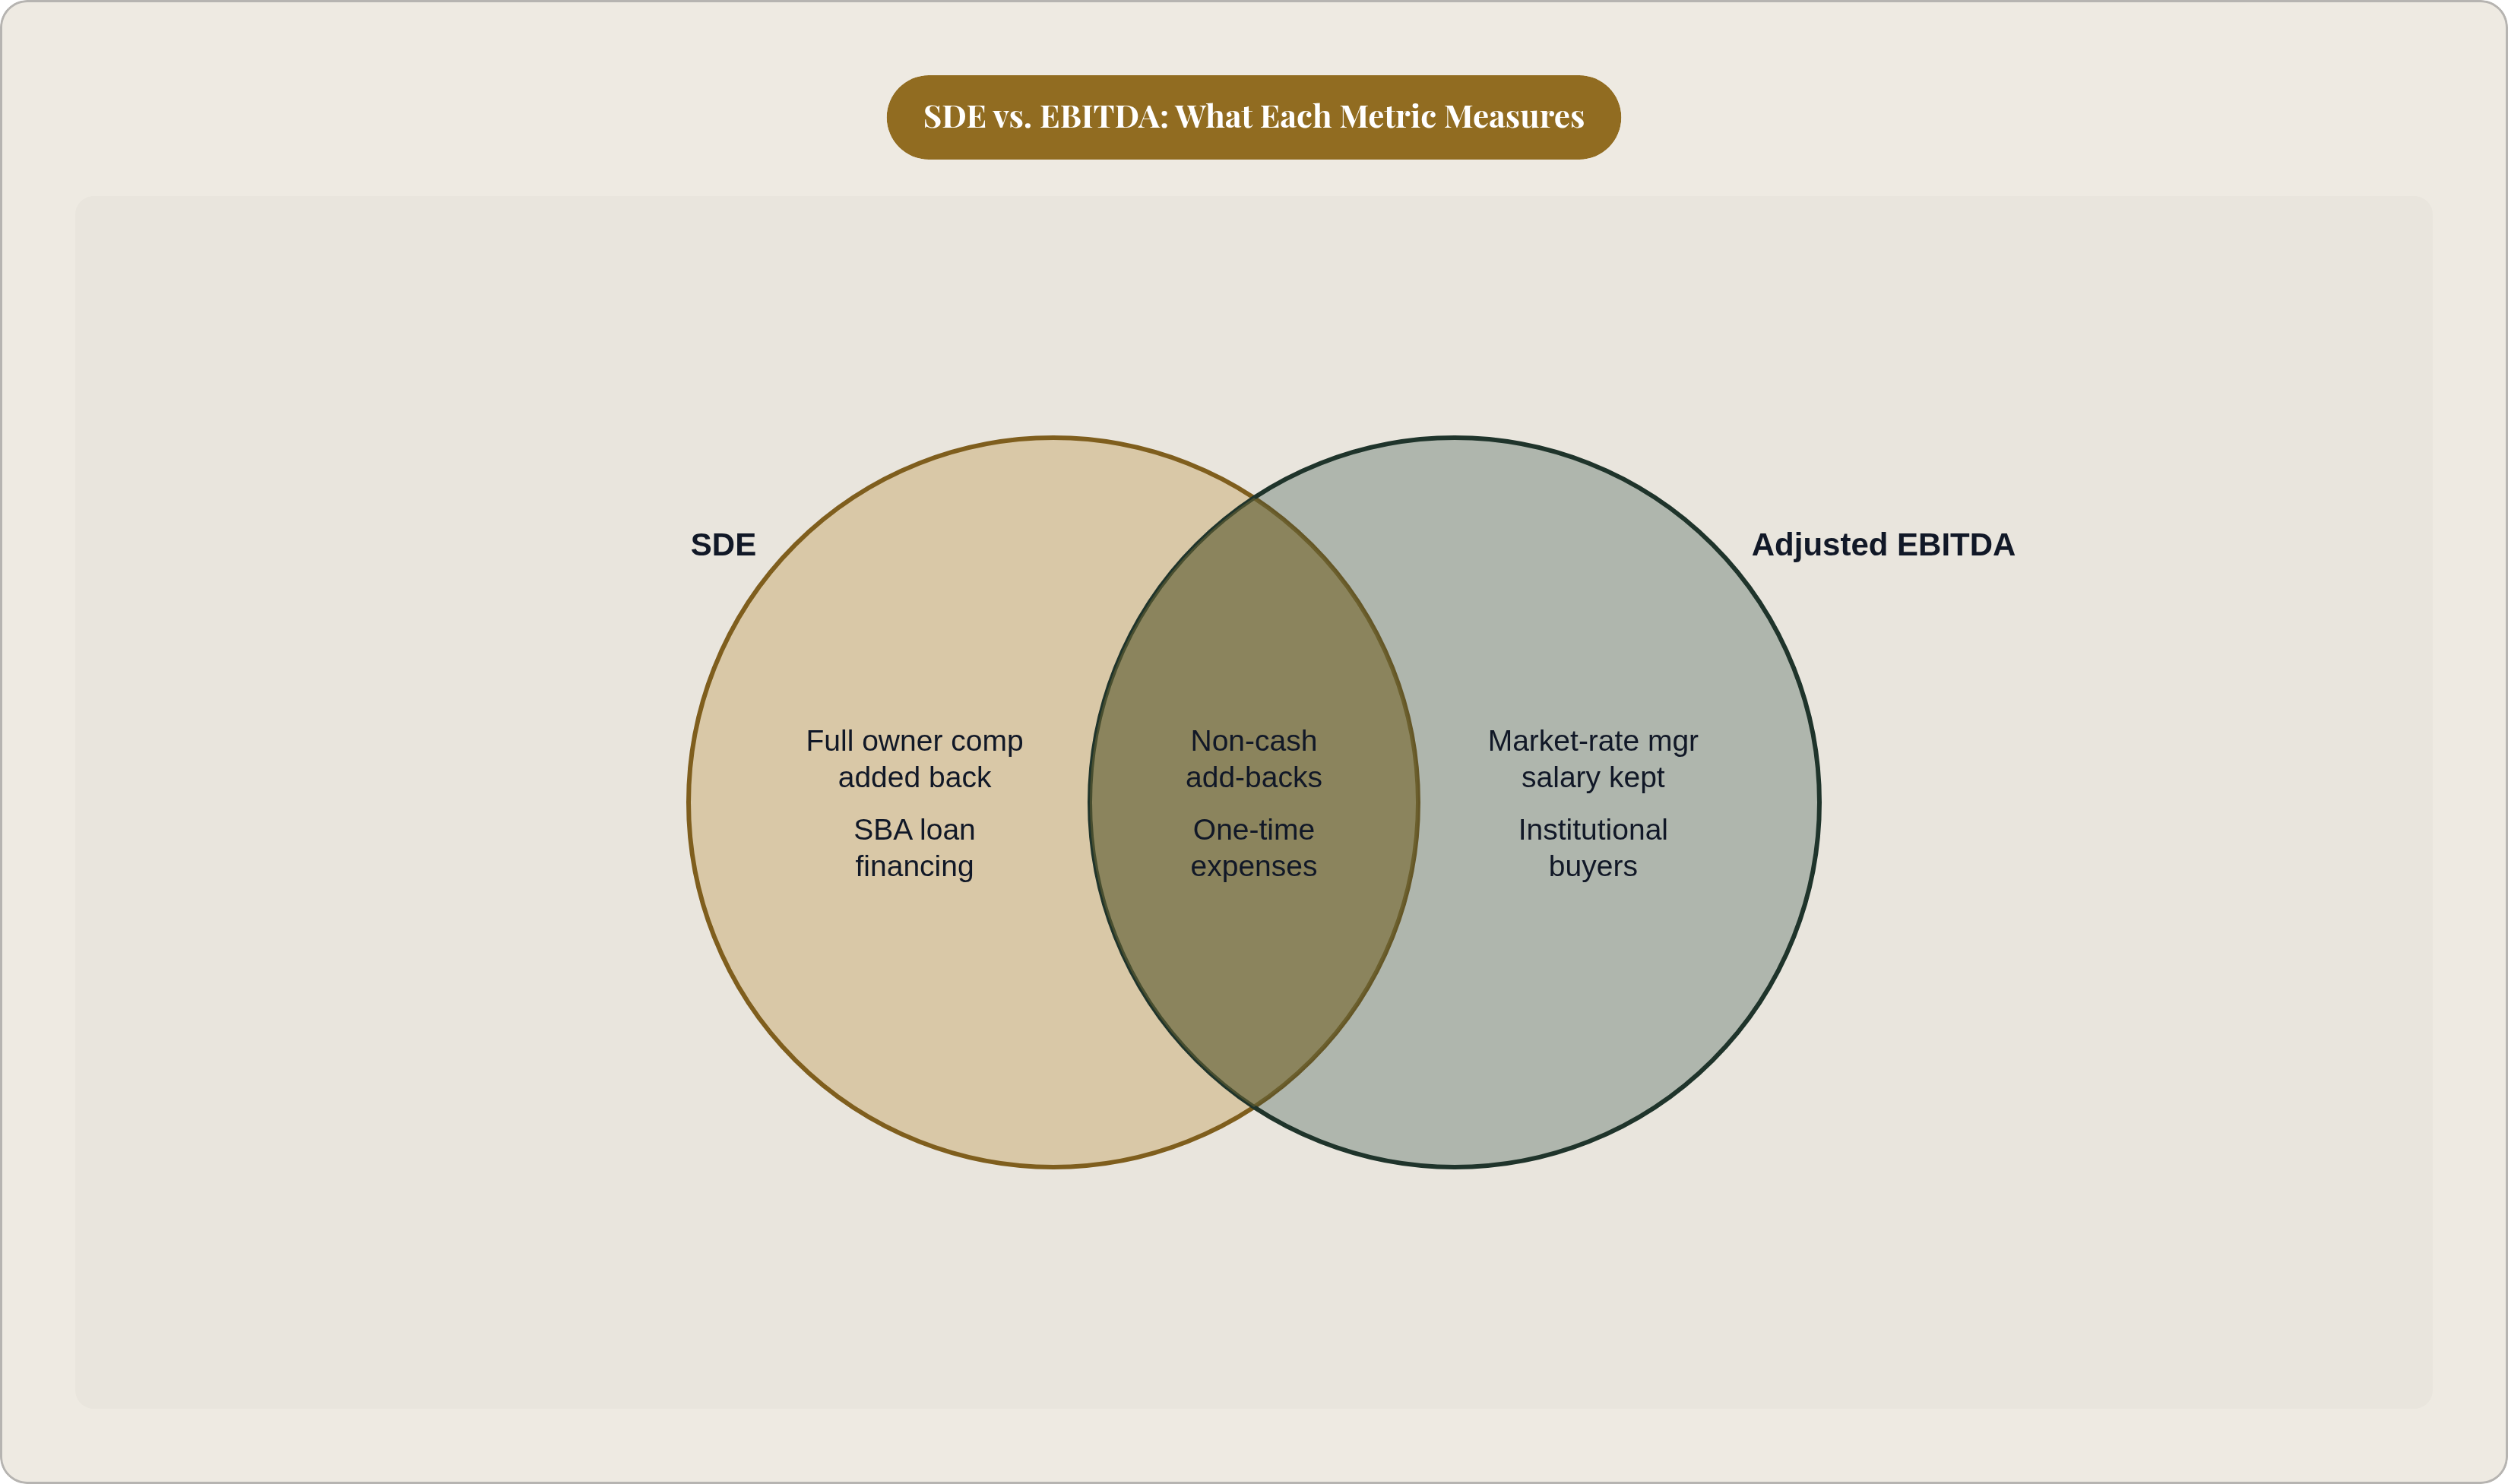
SDE adds back the owner's full compensation package, including salary, benefits, personal vehicle, family members on payroll who do not substantively contribute, and any personal expenses run through the business. The logic is direct: the buyer is purchasing the right to step into the owner's role, so whatever the owner was taking out of the business becomes part of what the buyer will have access to. SDE asks a specific question: what is this business worth to someone who will run it themselves?
EBITDA leaves a market-rate management salary in the expense column. The reasoning is equally direct: the buyer does not intend to run the business personally; a professional manager will be hired after the sale closes. The owner's personal compensation is therefore irrelevant to the business's earnings as a standalone enterprise. EBITDA asks a different question entirely: what does this business earn independent of who owns it?
Take a concrete example. A business producing a substantial net income with significant total owner compensation would generate a meaningfully higher SDE, once the full compensation and other standard add-backs are applied. The same business would produce a lower EBITDA figure, because the compensation stays in as an expense and only non-cash and financing items are stripped out. Neither figure is wrong. They are answering different questions for different buyers.
There is a nuance here that trips up sellers who have done enough homework to be dangerous. M&A advisors working in the lower middle market rarely use raw EBITDA; they use adjusted, or normalized, EBITDA. The critical distinction from SDE is that adjusted EBITDA adds back only the portion of owner compensation that exceeds what a market-rate replacement manager would cost, not the full compensation amount. If an owner is earning a high salary but a capable general manager would cost substantially less, only the gap gets added back. Sellers who conflate adjusted EBITDA with SDE will overstate their earnings in one context and understate them in another, either of which damages credibility at exactly the wrong moment.
How business size determines which metric buyers actually use
Most sellers assume the relevant dividing line is revenue. It is not. The dividing line is enterprise value, meaning the total purchase price, and conflating it with revenue produces badly wrong estimates about where you sit in the market.
Businesses that sell for under a few million dollars in total enterprise value are priced on SDE in the vast majority of cases. As enterprise value moves above that threshold toward the higher millions and beyond, EBITDA becomes the standard. The earnings threshold most advisors use as a practical shorthand: below a million dollars or so in owner earnings, SDE is the appropriate metric; above that level, you are entering EBITDA territory, with some advisors placing the full transition at a higher earnings threshold, where a professional management team has typically replaced the owner in operational decision-making.
The gray zone between those two earnings thresholds is contested. Some brokers continue using SDE; some private equity buyers underwrite with EBITDA; hybrid approaches are common. This is not a failure of the market to agree on conventions. It reflects the fact that businesses in this band vary enormously in how owner-dependent they actually are.
A four-tier orientation helps locate most businesses:
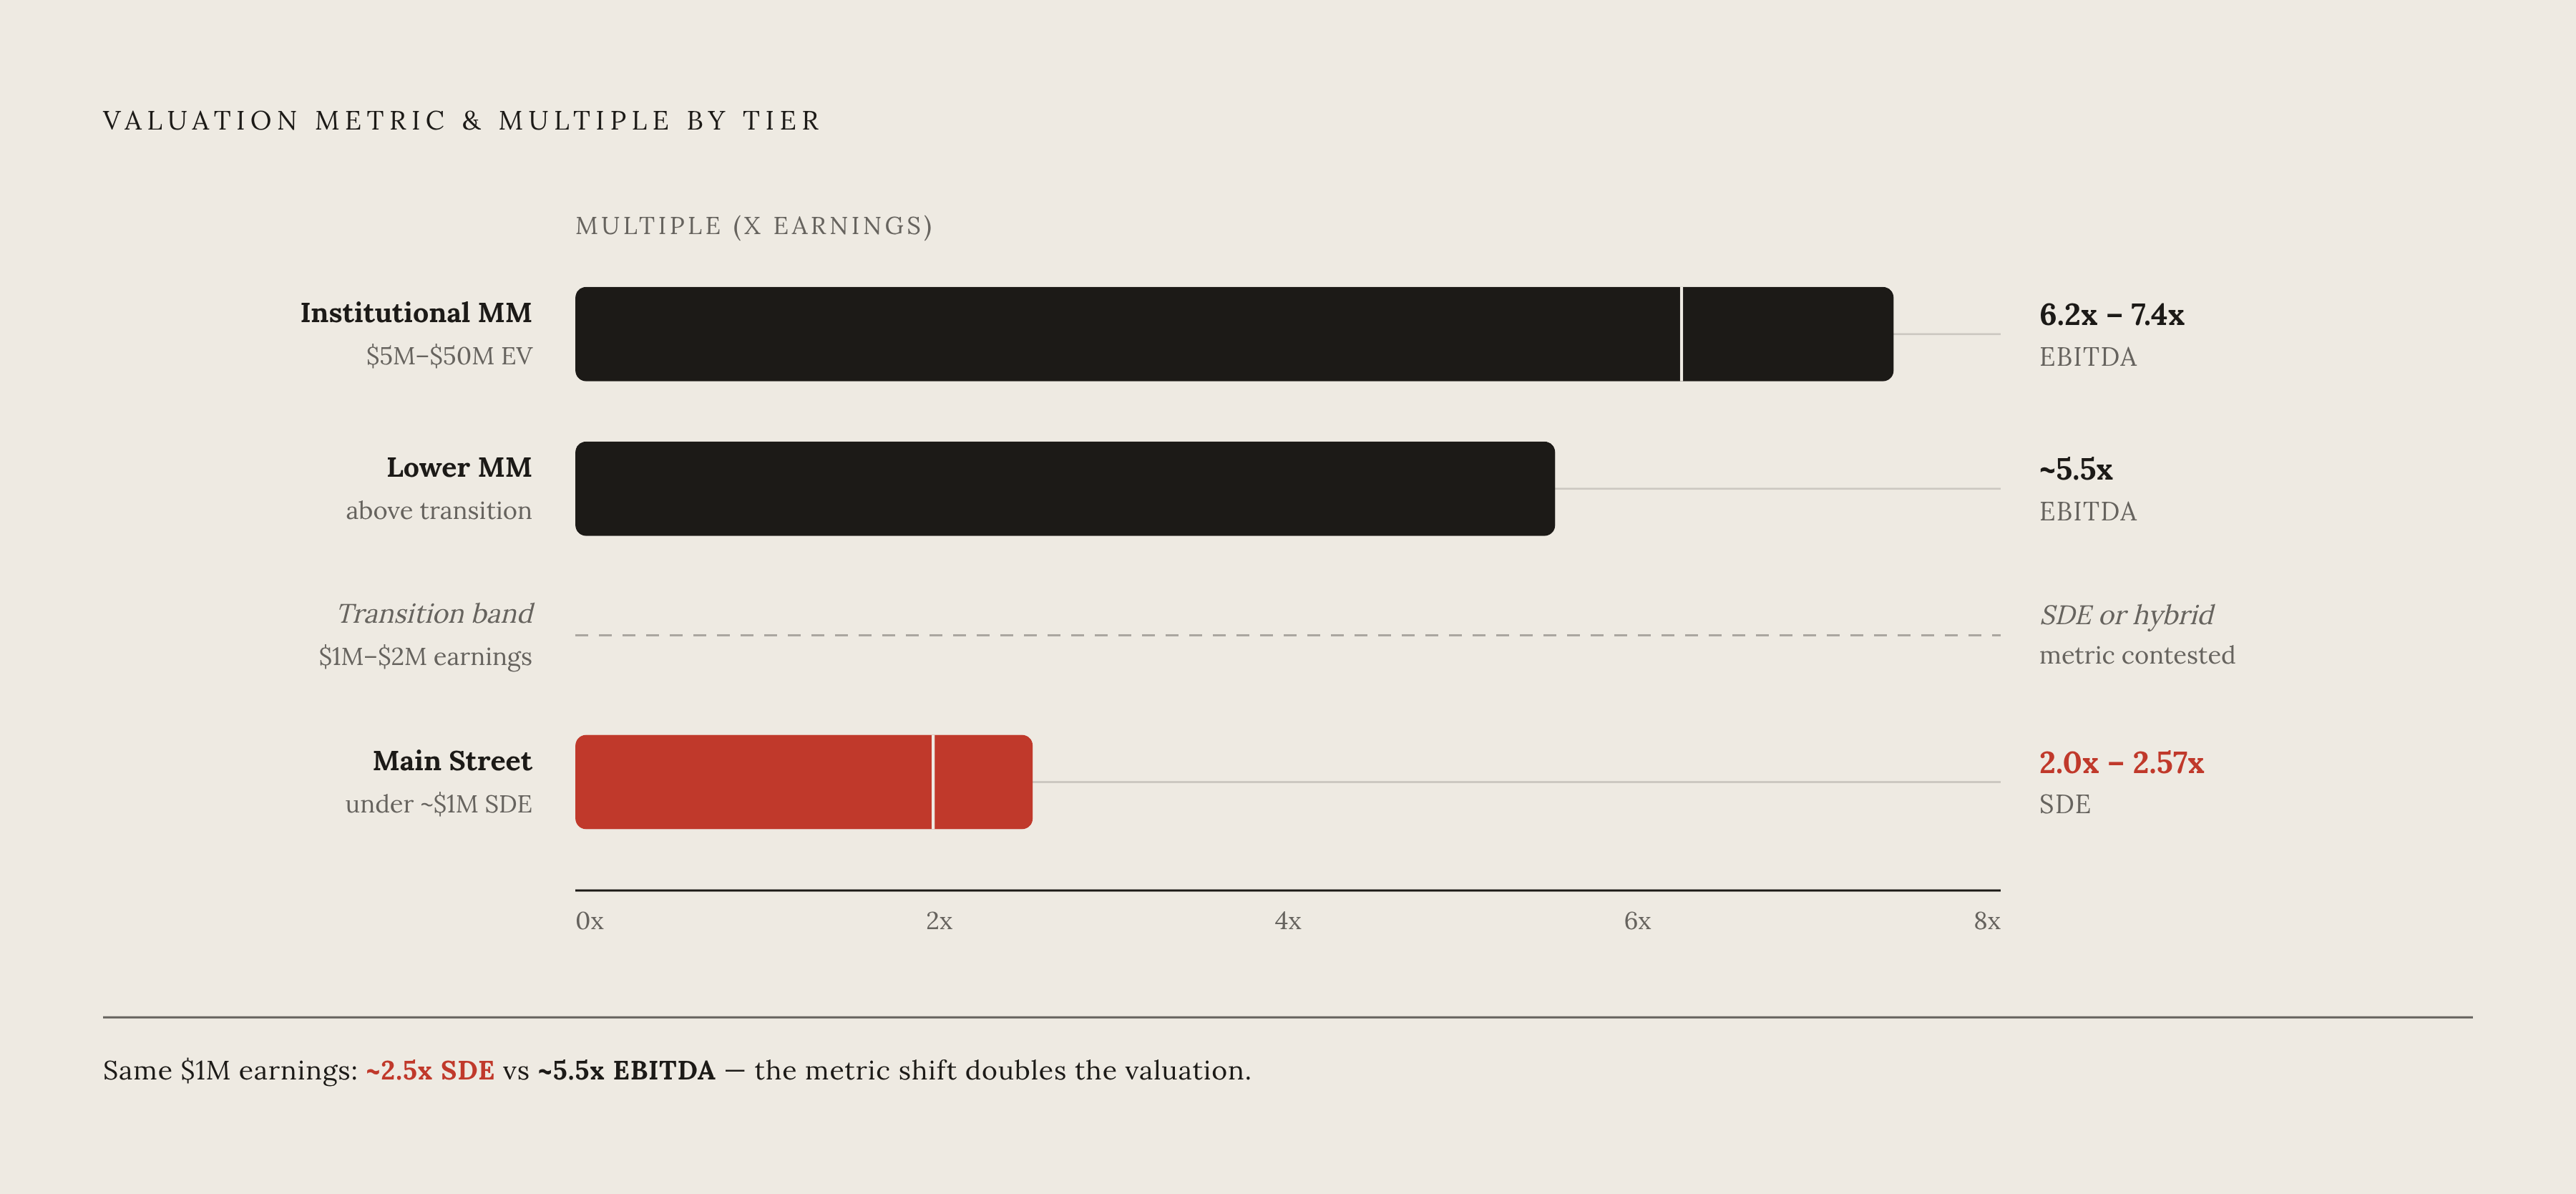
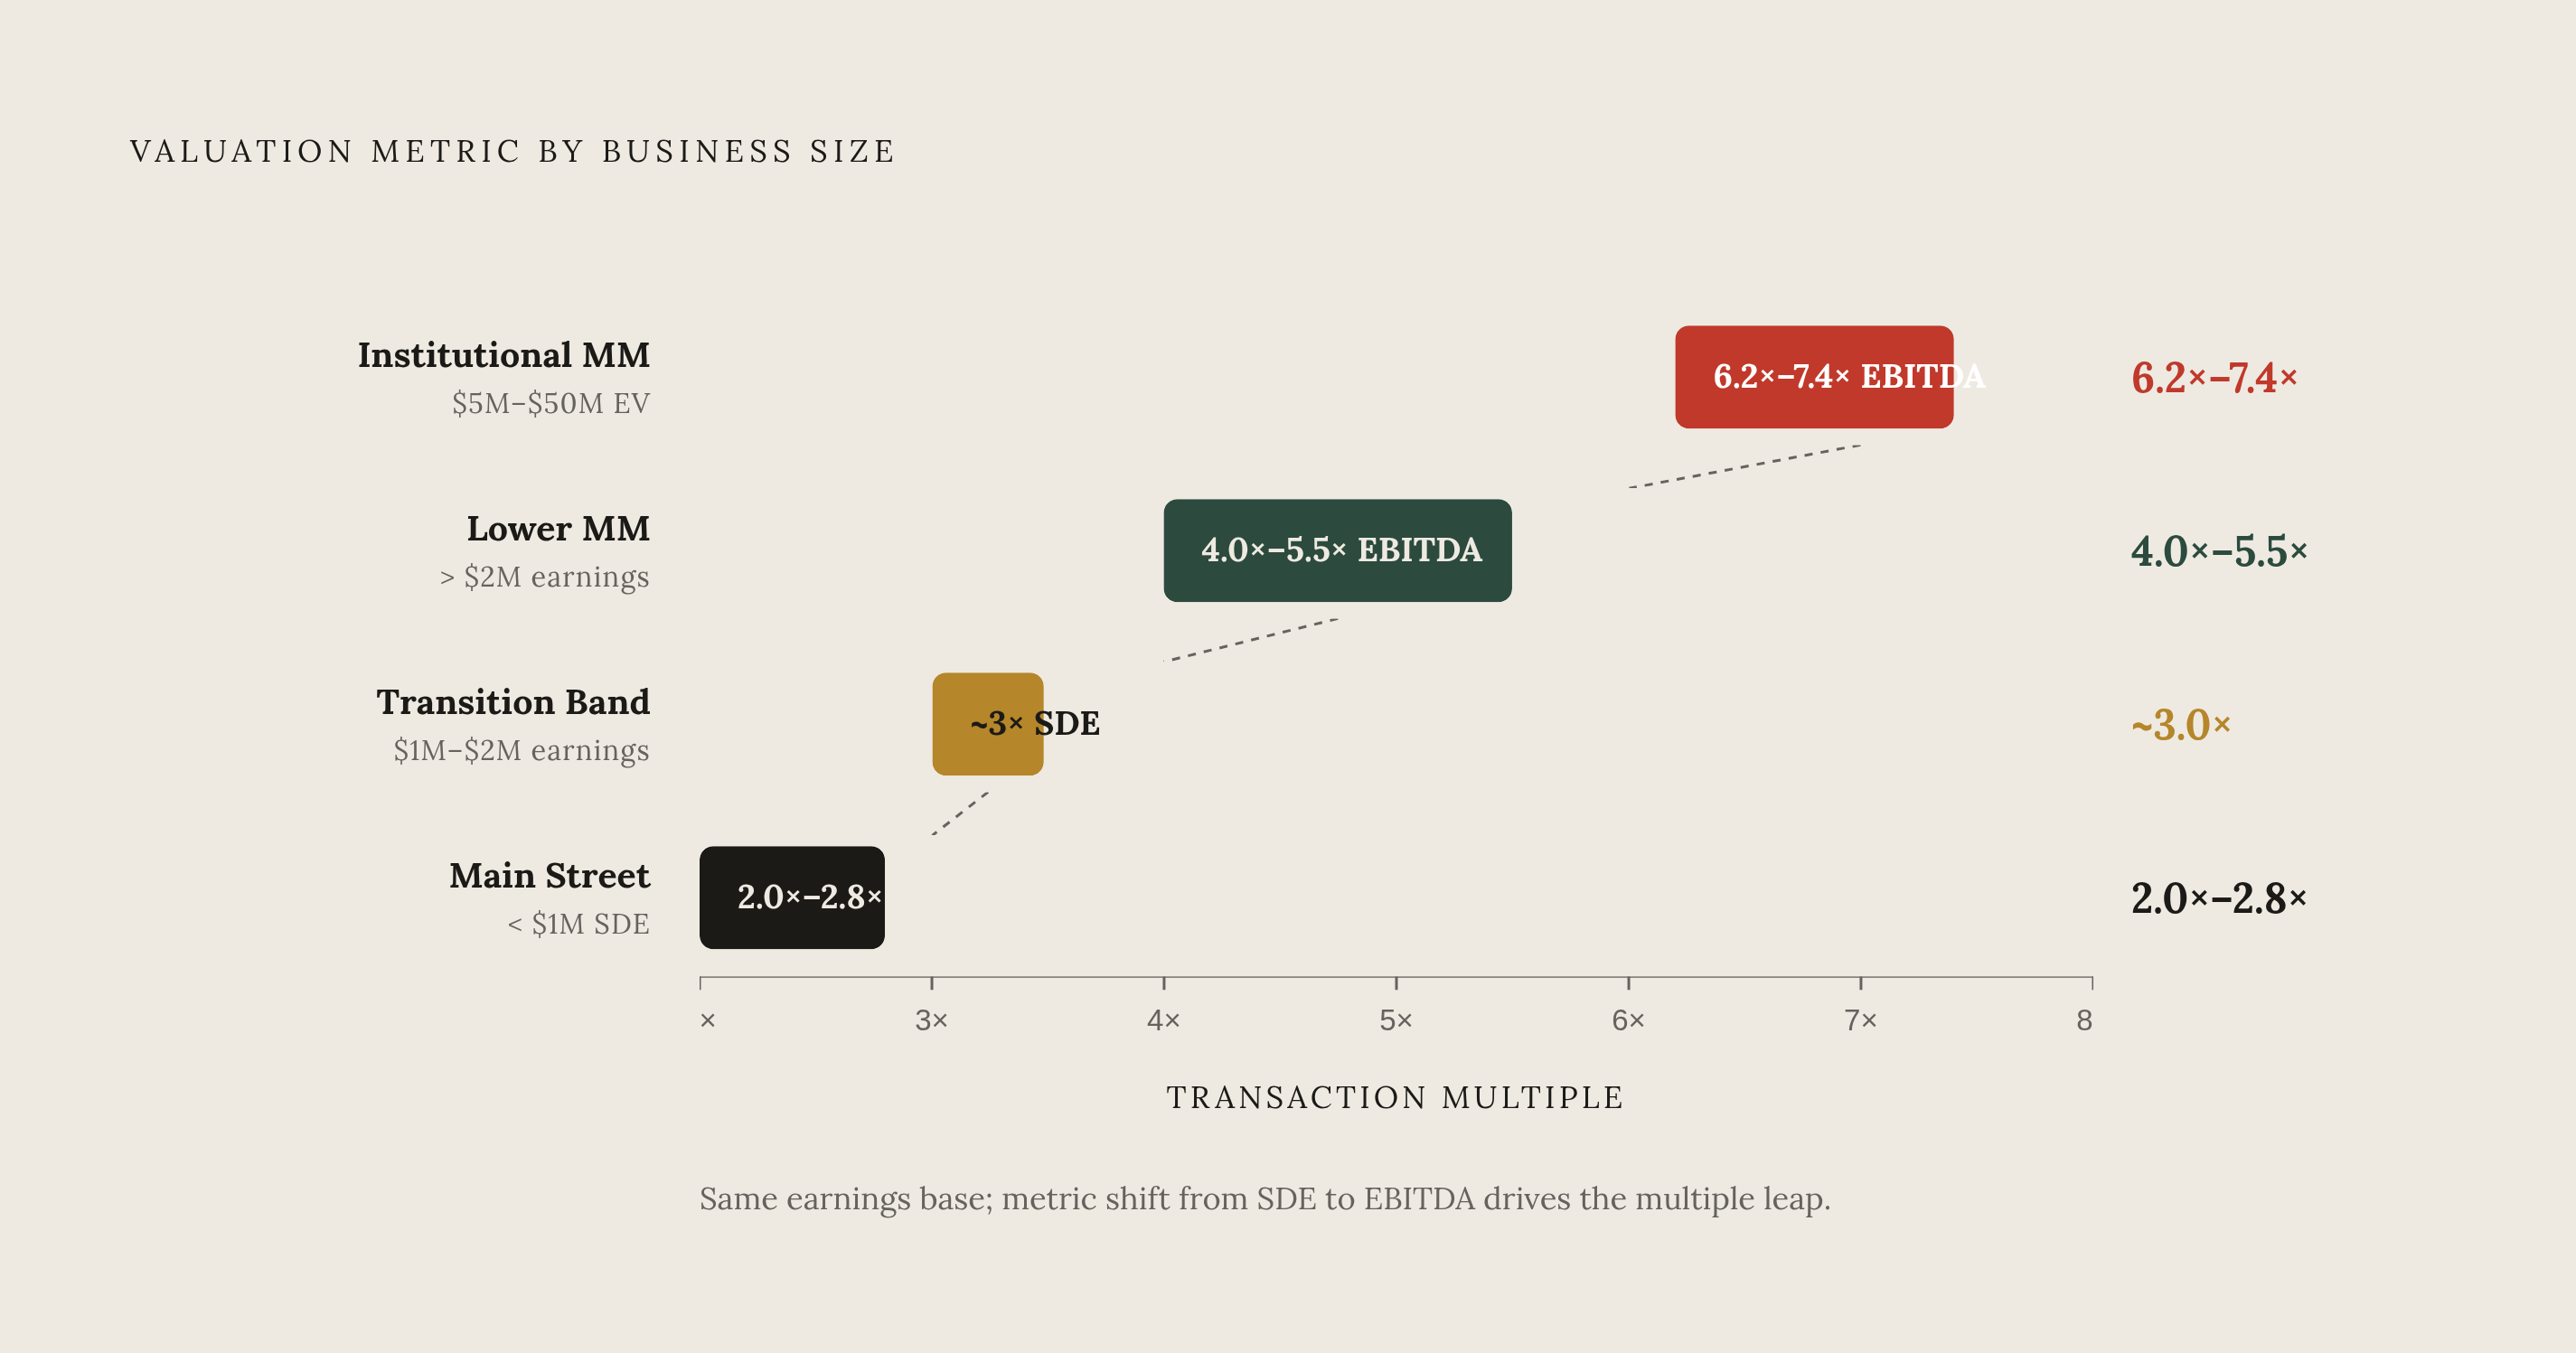
Main Street (under a few million dollars in revenue, under a million dollars or so in SDE): SDE territory, dominated by owner-operator buyers. Lower middle market, transition band (roughly one to two million dollars in earnings): the metric depends heavily on which buyer pool you are targeting. Lower middle market, above the transition (above the transition earnings threshold): EBITDA applies in the large majority of cases. Institutional middle market (roughly five million to fifty million dollars in enterprise value): EBITDA is the primary language institutional buyers speak.
IBBA Market Pulse data from closed transactions confirms the tier pattern with reasonable consistency. In the sub-$500,000 purchase-price band, median SDE multiples ran at approximately 2.0x; the $500,000 to $1 million band saw roughly 2.8x; the $1 million to $2 million band reached approximately 3.0x SDE. The $2 million to $5 million and $5 million to $50 million purchase-price bands both averaged approximately 4.0x EBITDA. These are purchase-price bands, not revenue bands; applying them to a revenue figure produces numbers that are not merely imprecise but structurally wrong.
The buyer pool behind each metric — and why it shapes valuation more than the math does
Here is the thing most sellers misunderstand about valuation metrics: the metric does not set the price. Buyers set the price, and buyers cluster predictably by deal size. The metric is downstream of the buyer pool, not the other way around. A seller who presents financials in the wrong format is not just creating confusion; they are signaling to the right buyers that they do not understand the market they are operating in.
SDE buyers are individual owner-operators. According to the 2025 Pepperdine Private Capital Markets Report, which surveyed business brokers on deal composition, 38% of buyers in this segment are first-time purchasers and 25% are serial small-business owners. They intend to replace the seller in the day-to-day role. SDE tells them directly what they can expect to earn from the combination of business income and their own labor, which is precisely the calculation they need to make. These transactions are frequently financed through SBA loans, and lenders in that program apply SDE-based cash flow tests to underwrite the debt service coverage. The metric is not just a valuation convention; it is baked into the financing structure.
EBITDA buyers are institutional and strategic. Private equity groups, family offices, and corporate acquirers are modeling acquisitions on standalone operating cash flow, because they will hire a management team and are indifferent to what the departing owner happened to take home. The 2025 Pepperdine Private Capital Markets Report found that 76% of investment bankers use adjusted EBITDA as their primary valuation method for privately held businesses, a figure that reflects both methodological preference and the expectations of the capital sources these advisors work with.
Capital availability follows the same split, and the consequences for sellers in the lower tiers are real. The 2025 Pepperdine report identified a meaningful shortage of capital for companies below a certain EBITDA threshold and a relative surplus for those above a higher threshold. Fewer qualified buyers means slower processes, more failed deals, and reduced negotiating leverage for sellers who have not deliberately cultivated the right pool.
The cost of metric misalignment is not abstract. Platforms like Succession AI, a tech-enabled exit platform for small and mid-market owners, use AI-driven valuation tools partly to surface this kind of metric mismatch early. The 2025 Pepperdine report found that 31% of M&A engagements ended without a transaction, with valuation gaps cited as the leading cause at 26% of failed deals. Importantly, when a gap existed, roughly 84% of cases involved a gap of 11 to 30%, large enough to kill a transaction but small enough that early alignment on the correct metric might have bridged it. That is a specific and preventable failure mode.
What current multiples actually look like in each tier
BizBuySell's transaction data shows the main-street SDE multiple trending upward over recent years, reaching approximately 2.57x in 2024, 2.61x in 2025, and 2.7x in early 2026. For most owner-operated businesses, a well-positioned exit lands between 2.5x and 3.5x SDE. Multiples above 4x SDE for a sub-$2 million business are unusual and are tied in most cases to a specific combination of recurring revenue, management depth, a sticky customer base, or active private equity interest in the sector. Multiples below 2x typically reflect owner dependency, customer concentration, or declining revenue, sometimes all three.
The EBITDA tiers tell a different story. GF Data, which tracks PE-backed private transactions, reported that businesses with enterprise values between $1 million and $10 million traded at approximately 5.5x trailing EBITDA in the first half of 2025, while the $10 million to $25 million band reached between 6.2x and 6.7x. IBBA Market Pulse data for late 2025 showed businesses with enterprise values between $5 million and $50 million averaging 5.5x EBITDA. GF Data's tracking of 360 PE-backed deals from mid-2024 through mid-2025 showed middle-market TEV/EBITDA multiples averaging between 7.0x and 7.4x, with regional variation ranging from approximately 6.7x in the Southwest to 8.1x in the Atlantic East. For full-year 2025, PE-sponsored deals from $10 million to $500 million held at a steady 7.2x adjusted EBITDA, even as total deal count fell materially from 2024.
What these figures reveal, taken together, is not just a multiple gap between tiers but a fundamentally different pricing logic. Consider a business where the owner takes home a substantial total annual compensation. Valued at 2.5x SDE, with the full compensation added back, you might arrive at a lower purchase price. Valued at 5x EBITDA by an institutional buyer, with a market-rate manager salary left in the expense column, you might arrive at a meaningfully higher figure. That difference does not reflect a disagreement about the business's performance; it reflects a difference in how each buyer class perceives what they are buying. One is acquiring a self-employment vehicle. The other is acquiring a company with standalone earning power. Sellers who do not understand this cannot intelligently target the right buyer pool or evaluate competing offers with any confidence.
Add-backs: where the earnings figure is won or lost before the multiple is ever applied
An add-back is a specific expense added to net income because it either will not recur under new ownership or reflects the current owner's personal financial decisions rather than the business's operating reality. This is where valuation is actually made or lost, well before anyone multiplies anything.
Legitimate add-backs in both SDE and EBITDA calculations include non-cash charges like depreciation and amortization; one-time or non-recurring items such as unusual legal fees, a one-time capital expenditure, or a pandemic-era cost or grant; and personal expenses run through the business, including owner vehicles, personal travel, and family members on payroll who do not contribute meaningfully to operations.
The treatment of owner compensation is where the two metrics diverge sharply in practice. SDE adds back the entire compensation package. Adjusted EBITDA adds back only the portion above what a market-rate replacement manager would cost. A seller presenting to an institutional buyer who has added back their full compensation, when a comparable GM would earn substantially less, has just told that buyer they do not understand the valuation framework being used. The deal does not end there, but credibility takes a hit that is difficult to recover.
Buyers scrutinize every add-back, and unsupported claims are stripped. When an item is removed from the earnings base and the multiple is between 3x and 7x, the dollar impact on enterprise value is immediate and compounding. The burden of proof sits entirely with the seller: clean books, clear documentation, and a coherent narrative about why each item is non-recurring. The 2025 Pepperdine data showing that 76% of investment bankers use recast EBITDA as their primary method, combined with the finding that guideline transaction comparisons carry the largest weight in the valuation methodology mix, means that the quality of the recast financials directly determines how the deal gets positioned. A defensible add-back schedule is not a supporting document; it is a core deliverable.
What changes at the transition point — and how to position your business to benefit from it
The transition from SDE to EBITDA territory is not automatic, and it is not purely a function of earnings crossing a threshold. EBITDA buyers are underwriting a company, not a person. If the owner is operationally irreplaceable, if key customer relationships would leave with the founder, if no one below the owner can make meaningful decisions independently, then EBITDA multiples do not apply regardless of how large the earnings figure is. The metric follows the business's actual structure, not just its size.
The moves that create EBITDA positioning are structural and require lead time. Installing or formalizing a second-in-command or operations manager before going to market matters enormously; so does deliberately shifting client relationships to the business entity rather than to the founder personally. Three years of clean, consistently prepared financials, ideally reviewed or audited by an independent firm, give buyers the data they need to underwrite with confidence. Normalizing owner compensation to defensible market-rate levels well before an exit process begins avoids the awkward negotiation over add-back legitimacy that frequently derails deals.
The gray zone between those earnings thresholds is not merely a classification problem. It is a real opportunity. A seller who can credibly present EBITDA-style financials, point to professional management already in place, and demonstrate that the business functions without daily owner involvement may access a buyer pool paying 5x or more rather than 3x, on the same earnings base. The metric shifts because the buyer pool shifts. The math follows.
Timing is the constraint most sellers underestimate. These structural changes take time to implement, and they take additional time to show up convincingly in trailing financial data. Advisors consistently recommend beginning exit preparation two to three years before a planned transaction. Sellers who wait until they are ready to list have already foreclosed the positioning options that would have shifted their multiple tier. The decision about which metric tier to target is, practically speaking, a decision that needs to be made years before a letter of intent is ever discussed.
For sellers in the $1 million to $2 million earnings gray zone who are actively trying to position toward EBITDA, the buyer-targeting question becomes as important as the financial recast. The buyer-targeting question becomes as important as the financial recast, since identifying which buyers in the market are actively looking for businesses at a given metric and earnings profile can matter significantly when the right buyer pool determines whether a 3x or a 5x multiple is achievable.
How to figure out which metric applies to your business right now
Three questions locate a business on the framework with enough precision to be actionable.
First: what is your realistic enterprise value range? This is not revenue; this is what a buyer would actually pay for the business. If that number is likely in the lower millions, you are in SDE territory. If it is well into the higher millions, EBITDA is the operative framework. In between, the answer depends on the next two questions.
Second: what are your owner's earnings, and what would a market-rate replacement manager cost? If your total owner compensation is below seven figures and you are operationally central to the business, you are in SDE territory. If your compensation meaningfully exceeds what a professional GM would cost, and if the business could plausibly run without you, you are approaching EBITDA territory. The gap between your compensation and the market-rate replacement cost is the number that matters; it is what an institutional buyer will use in their recast.
Third: is the business structurally independent of you? This is the question most sellers answer optimistically and most buyers answer skeptically. Documented processes, a functioning management layer, customer relationships that belong to the entity rather than the founder, financial reporting that does not require the owner to explain it, these are the observable characteristics that institutional buyers use to answer this question. If the honest answer is that the business would struggle materially without your daily involvement, the business is in SDE territory regardless of its earnings level, and positioning it otherwise will create friction that surfaces during diligence at the worst possible time.
The metric you use to present your business is not a preference or a negotiating tactic. It is a signal to the buyer pool about what kind of business you are selling and whether you understand the market you are entering. Getting it right before the first conversation is not preparation; it is the precondition for every conversation that follows.