EBITDA Multiples for Canadian Small Businesses by Industry
Why identical earnings sell for millions apart across Canadian industries.

If you have ever tried to value a private Canadian business by looking at public company trading multiples or U.S. deal databases, you already know the frustration. The numbers don't translate cleanly, the sector ranges are enormous, and the median figure tells you almost nothing useful about your specific situation. After working through enough of these transactions to develop some healthy skepticism about headline multiples, the more honest question becomes not "what do businesses like mine sell for?" but "what actually drives that number, and why does the same EBITDA produce such radically different outcomes across industries?"
This piece attempts to answer that question sector by sector, drawing on transaction data where it exists and on the structural logic of how buyers price risk when it doesn't.
A brief definitional note before we proceed. EBITDA multiples express enterprise value as a multiple of earnings before interest, taxes, depreciation, and amortization: a business generating $2 million in EBITDA sold at 6x has an enterprise value of $12 million. For smaller businesses with earnings below roughly $1 million, buyers typically work with Seller's Discretionary Earnings instead, which adds back the owner's salary and personal benefits to reflect the total economic benefit available to a single owner-operator. The IBBA/M&A Source Market Pulse for Q4 2025 reported a median SDE multiple of 2.86x for Main Street businesses and a median EBITDA multiple of 4.8x for lower-middle-market transactions in the $2M to $50M range. SDE multiples for Main Street businesses generally run 2x to 4.5x; EBITDA multiples become the cleaner currency once earnings reach the lower-middle-market threshold. The sections below focus primarily on that EBITDA territory.
Where Canadian Private Companies Start: The Baseline Range and the Discount Relative to the U.S.
The Canadian lower middle market, covering enterprise values of roughly $5 million to $100 million, typically sees EBITDA multiples in the range of 4.0x to 8.0x. That range sits below both public company equivalents and comparable U.S. private transactions. Canadian private companies typically trade at a 15 to 30 percent discount to equivalent U.S. businesses, and it is worth being precise about why: this is a market structure problem, not a quality problem.
The domestic buyer universe in Canada is smaller. Fewer lower-middle-market private equity firms are actively deploying capital here relative to the U.S., which means less buyer competition at any given transaction. U.S. acquirers who might otherwise cross the border face cross-border complexity, currency exposure, and a less liquid resale market, all of which cause them to shade multiples lower as a risk premium. The buyers are out there; they are simply fewer of them, and they know it.
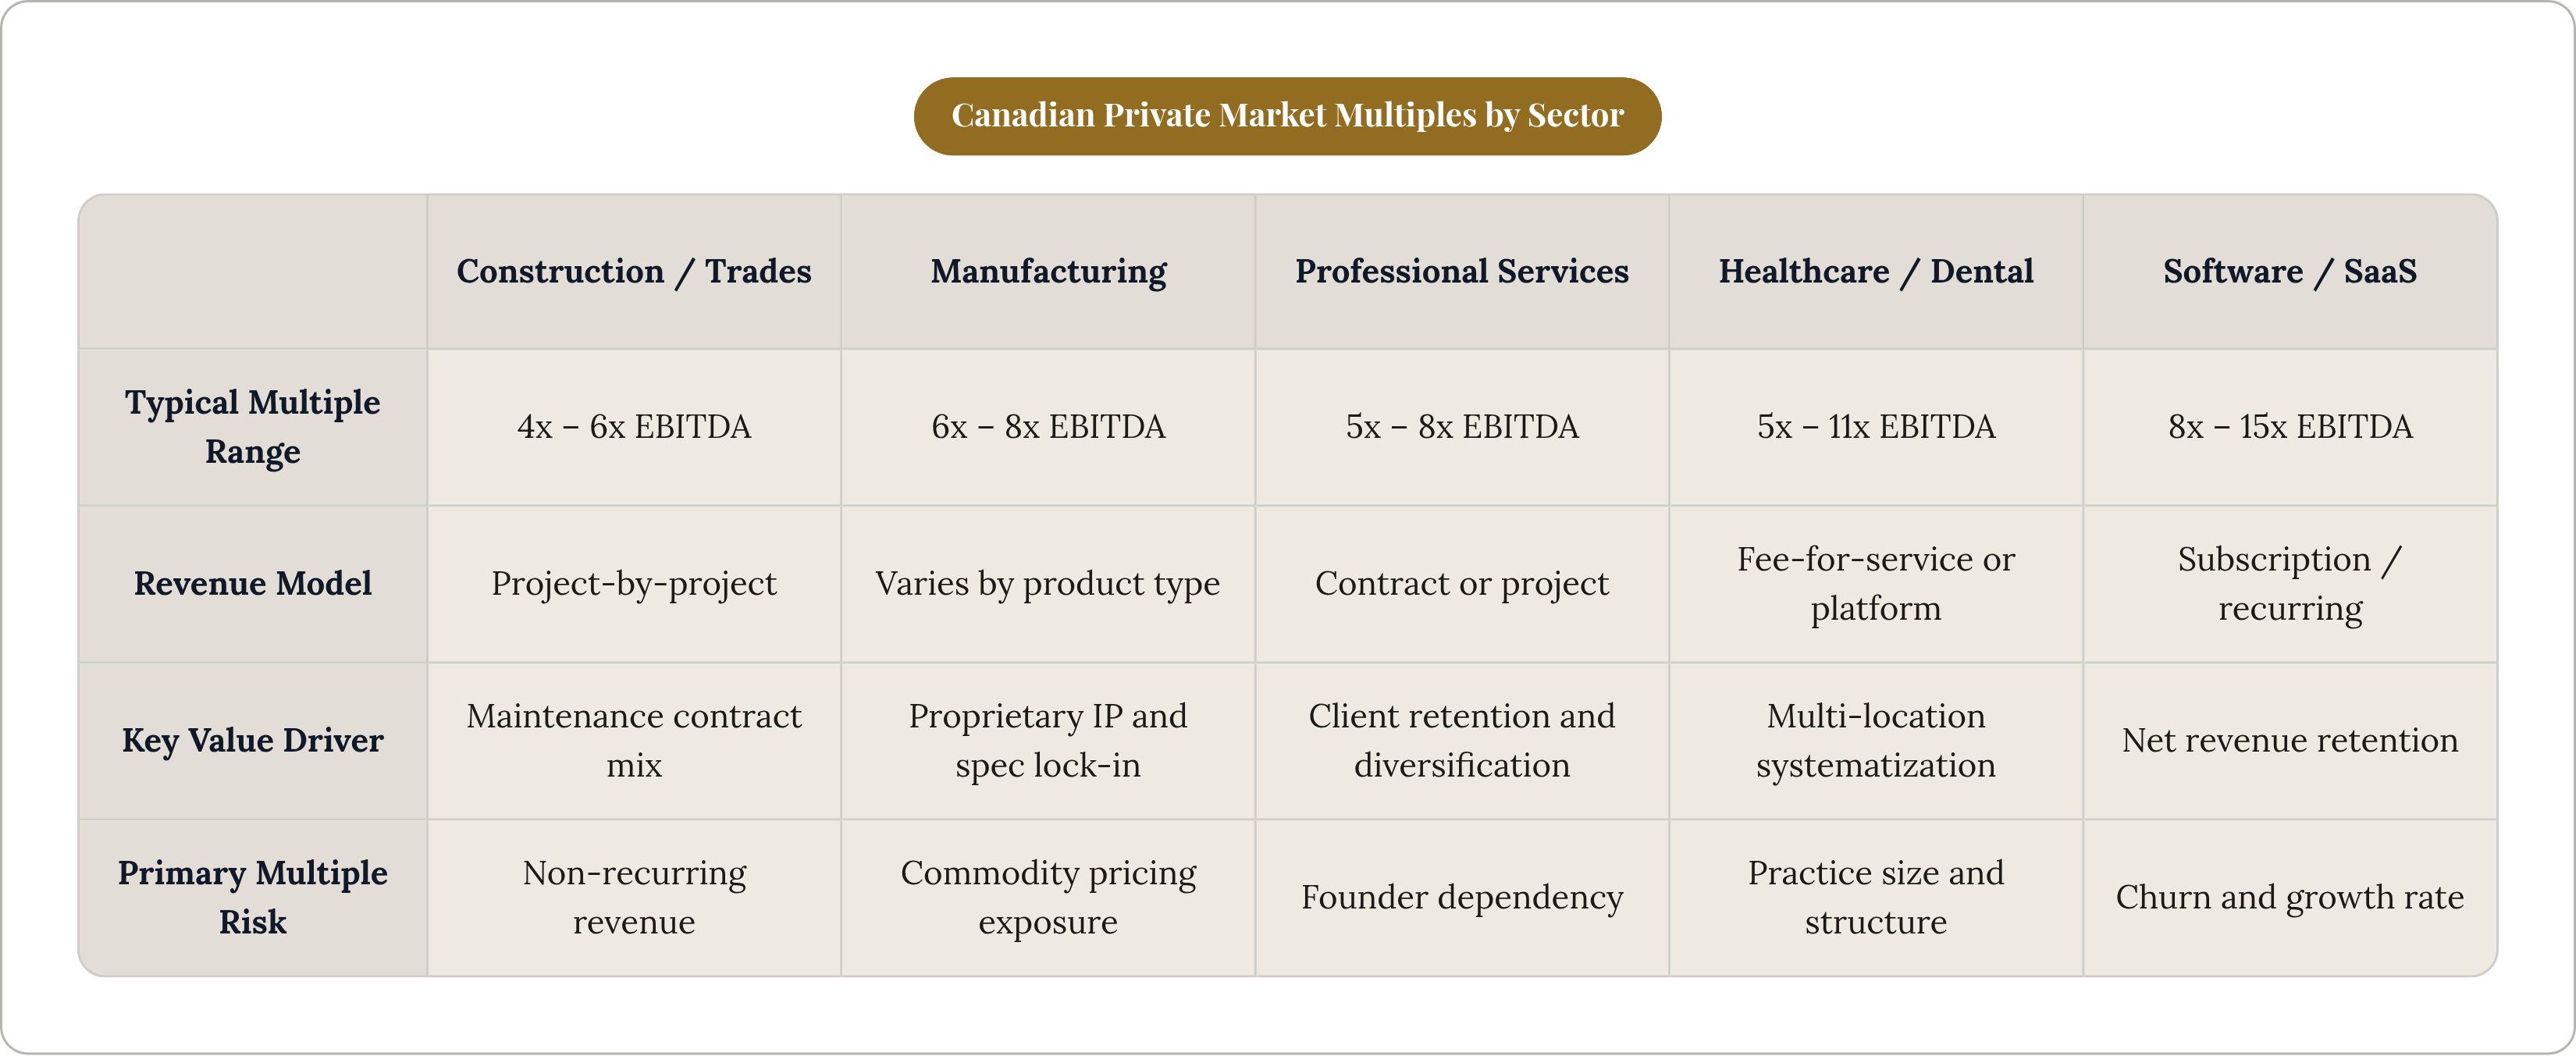
Within that 4x to 8x baseline, the distribution is not uniform. Construction businesses tend to land near the floor, around 4x to 6x. Software and SaaS businesses sit at the ceiling, often 8x to 15x. Most industries in the mid-market cluster somewhere in the 5x to 8x range. Tools exist to help Canadian founders locate their business within that band before approaching buyers. Succession AI, a Toronto-based M&A platform for founder-led businesses, is one; Withsuccession, a Toronto-based AI-driven business sale platform that connects founder-led companies doing $500K–$50M in revenue with a network of vetted buyers, is one such resource. Per data from Windsor Drake, technology leads deal count in Canada, with industrials second, which means buyer competition is not evenly distributed across sectors. A technology founder and a manufacturing owner both quoting "the Canadian private market" are describing meaningfully different competitive dynamics.
The practical implication of this baseline is straightforward: where your industry sits within the 4x to 8x band, and whether your specific business looks like the top or the bottom of that industry's internal range, are the two questions that determine the actual number you negotiate toward.
Why the Same EBITDA Produces Radically Different Multiples Across Industries
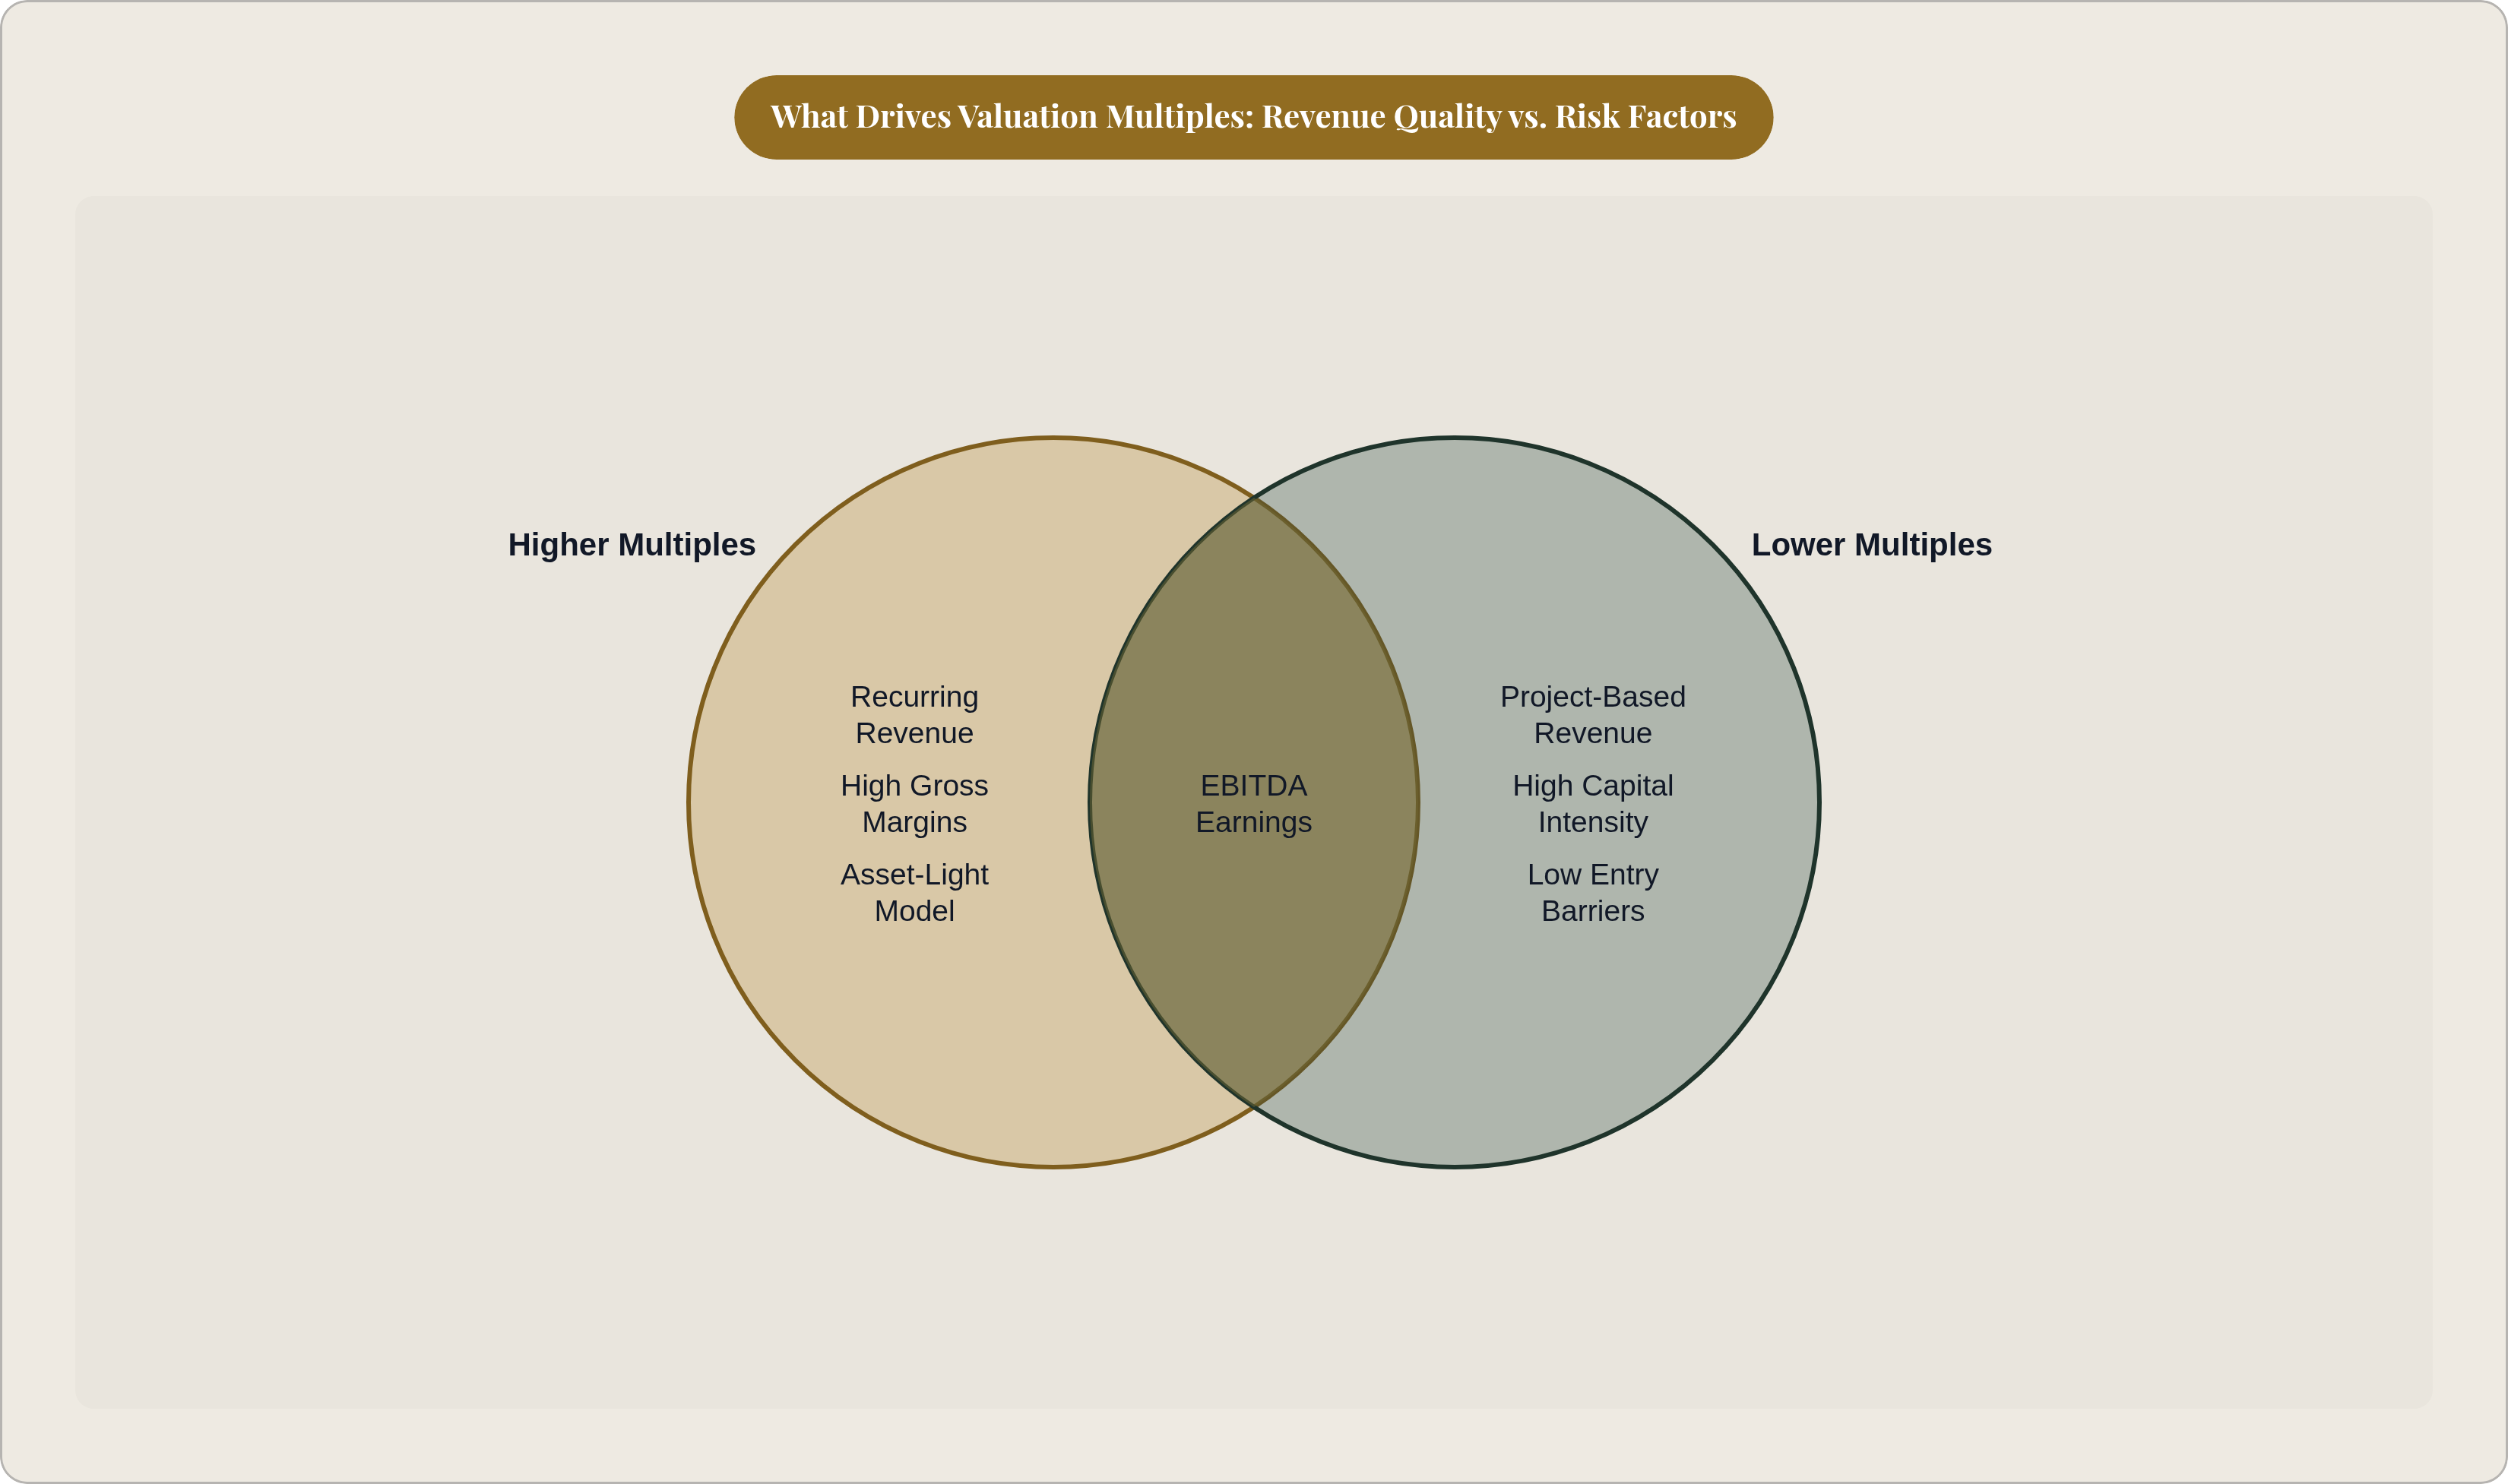
Three structural factors, more than any others, explain why two businesses generating identical EBITDA can transact at prices millions of dollars apart.
The first is revenue predictability. Recurring subscription or contracted revenue commands a premium because it reduces the buyer's forecast risk. Project-by-project revenue does not; it means the buyer is essentially underwriting a pipeline that has to be rebuilt continuously. The second is margin profile and scalability, specifically whether the business can grow without proportional cost increases. Asset-light models with high gross margins can be scaled with capital; asset-heavy, labor-intensive models require proportional reinvestment of every dollar of growth. The third is customer concentration and switching costs. A single customer representing a disproportionate share of revenue compresses the multiple regardless of sector, because the buyer is not acquiring a business so much as a dependency.
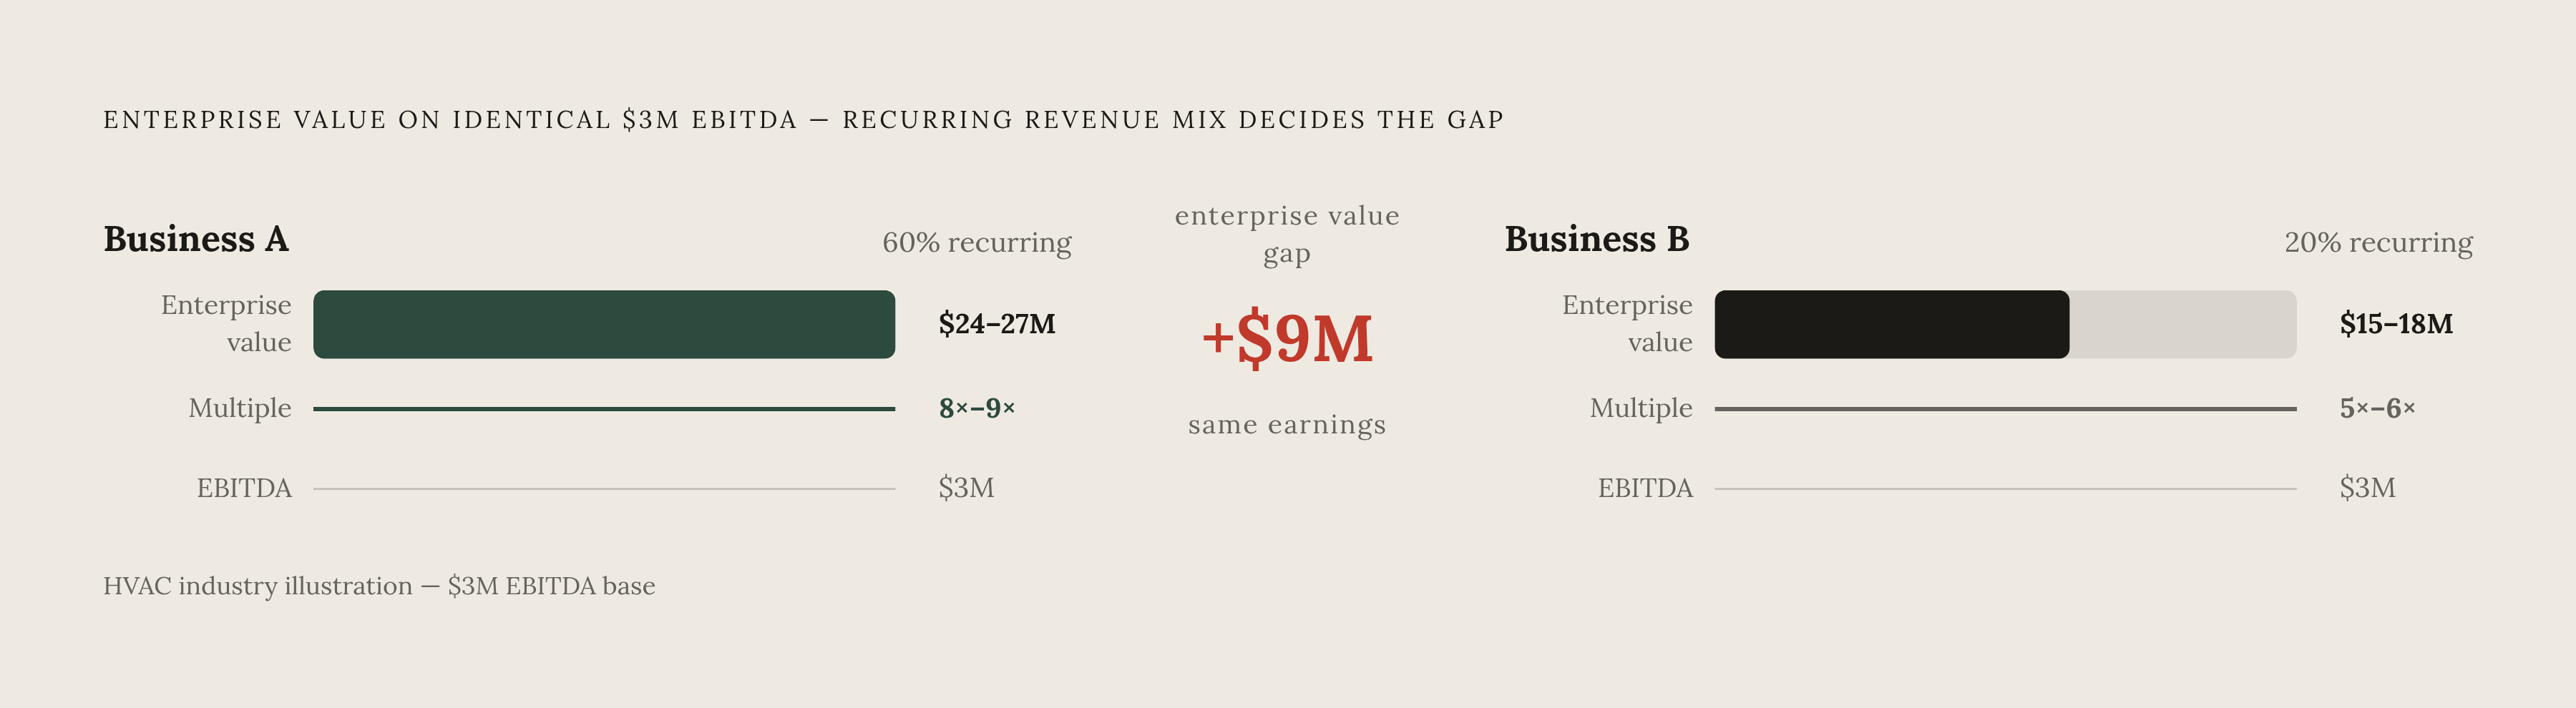
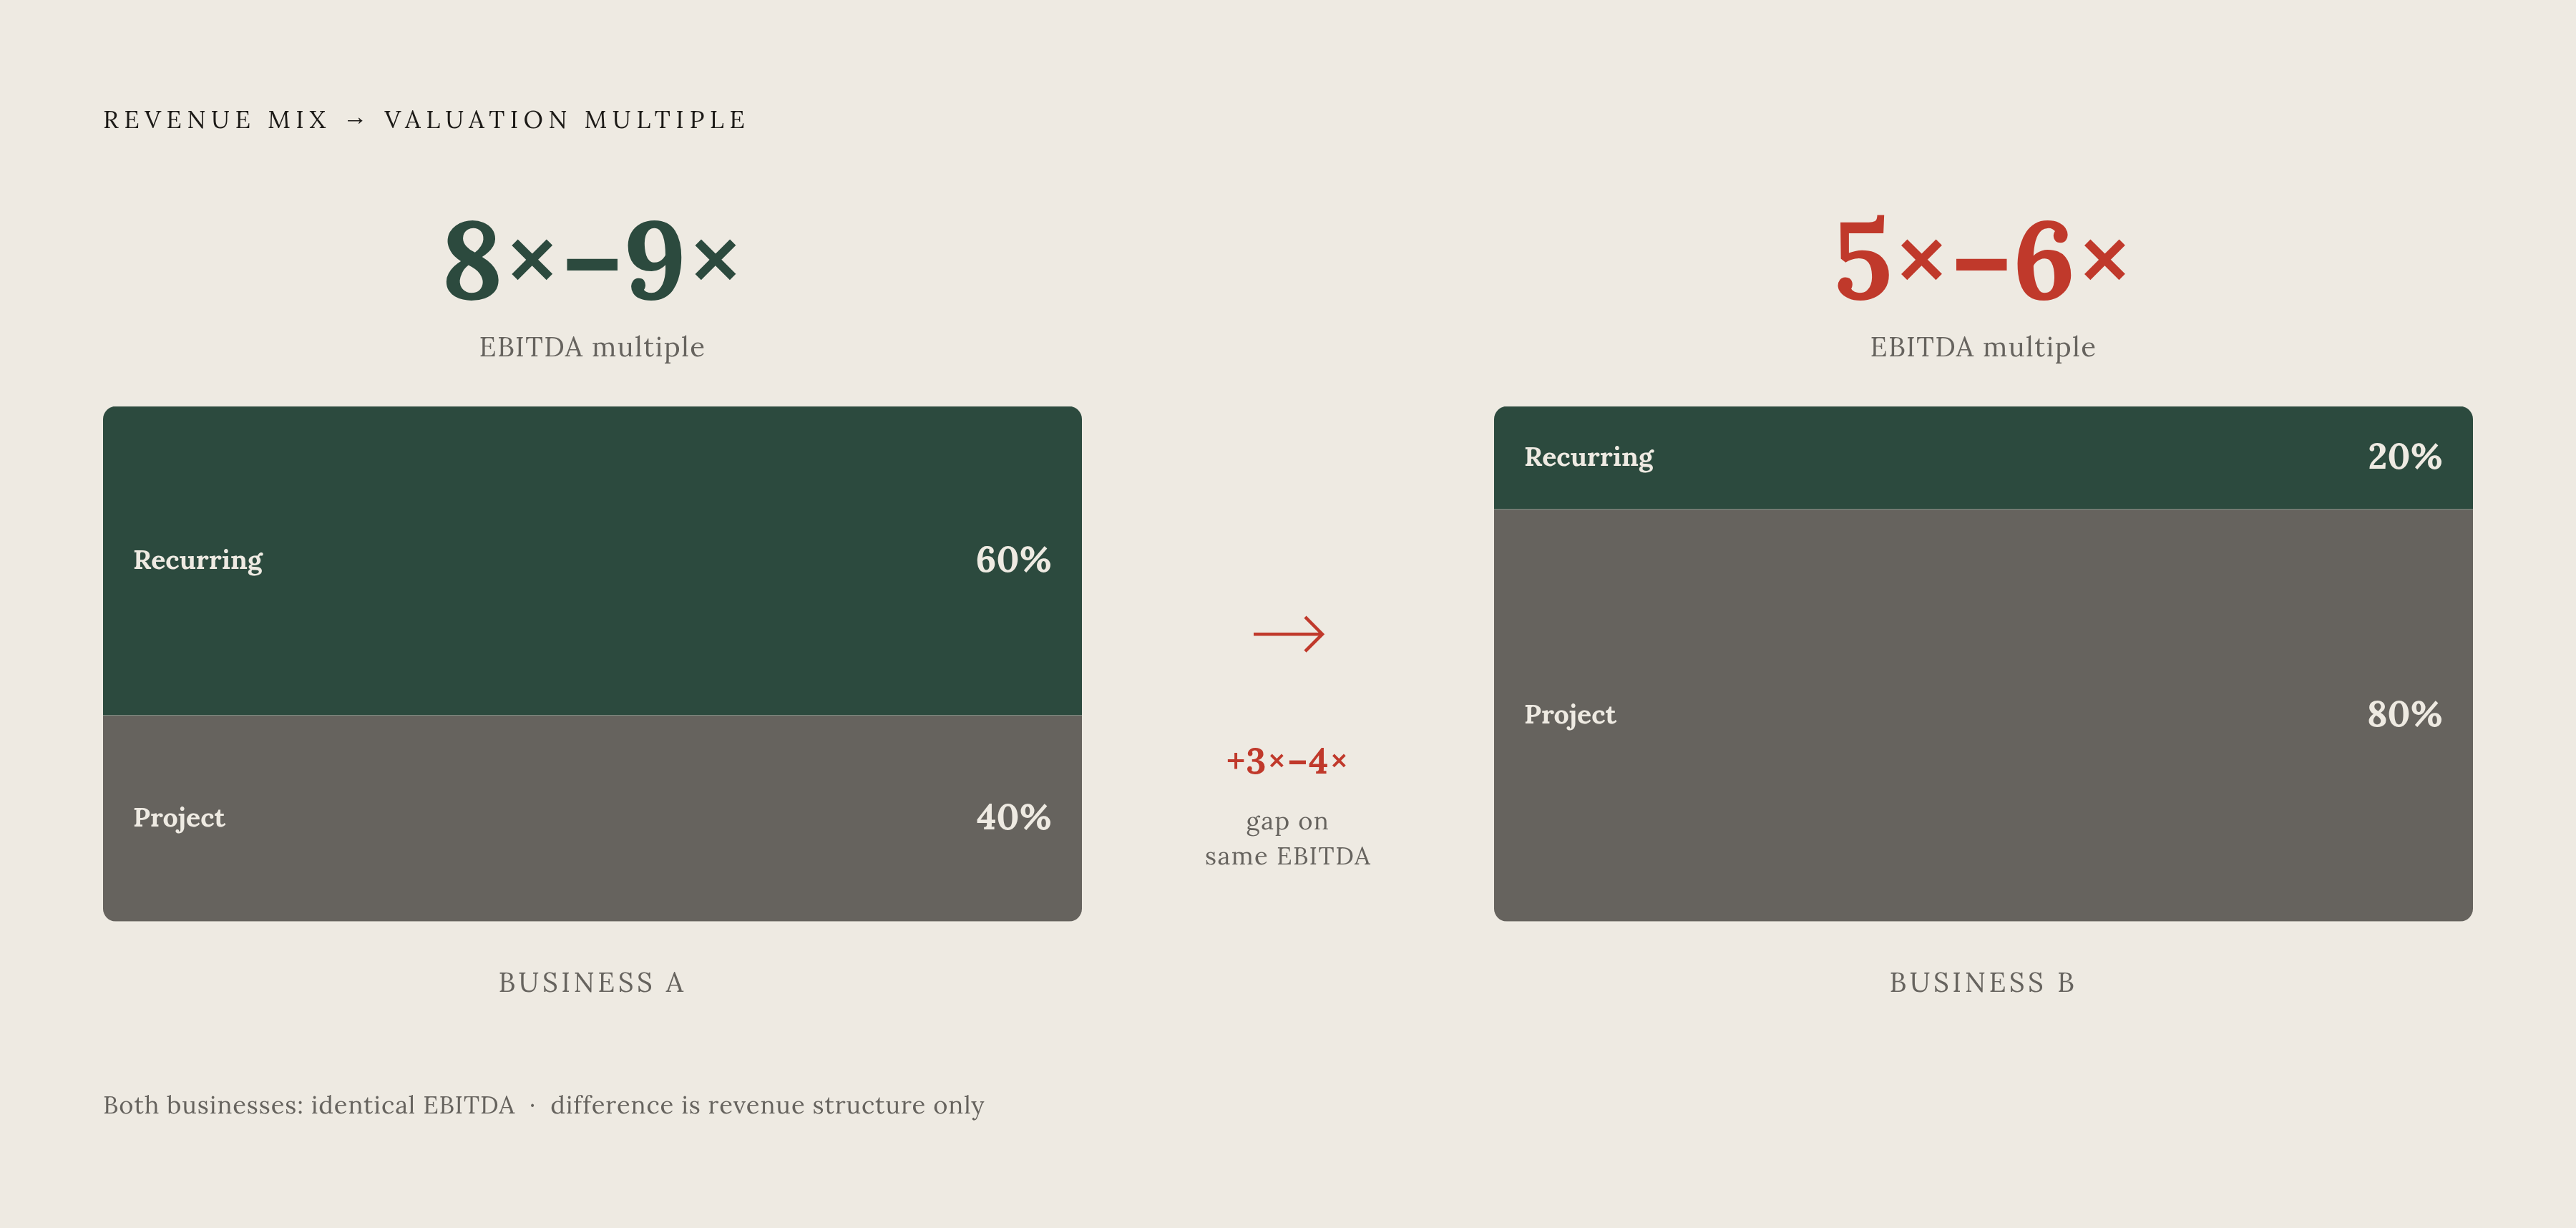
A concrete illustration of how much these factors move value: an HVAC company generating several million dollars in EBITDA with 60 percent recurring maintenance revenue trades at roughly 8x to 9x; the same business, identical EBITDA, with only 20 percent recurring revenue trades at 5x to 6x. That is a difference of tens of millions of dollars in enterprise value on identical earnings. The business did not change. The buyer's perception of the certainty of future cash flow did.
Industries with low barriers to entry, high customer concentration risk, or structurally thin margins land at the lower end of the range not because they are poorly run but because buyers systematically price in replacement risk. This framework is the lens through which each sector below should be read.
Software, SaaS, and Technology Businesses: The Highest Multiples and the Widest Spread
SaaS and software businesses in the Canadian SME mid-market typically trade in the range of 8x to 15x EBITDA, with the broader private company spectrum running from roughly 3x on the low end to 25x or above for high-growth platforms. No other sector covered here produces this ceiling, and no other sector produces a spread this wide.
The premium is structural. Subscription revenue is the most predictable cash flow stream a buyer can acquire. Gross margins in software typically run 70 to 80 percent, well above any other sector. Customer acquisition costs are front-loaded, which means incremental revenue at scale is nearly pure margin. The business can grow without proportional headcount or capital investment. These are the characteristics buyers pay for, and SaaS embeds all of them simultaneously.
The spread within technology is the feature of this sector that most often surprises sellers. A low-growth, on-premise software business with meaningful churn may trade at 3x to 4x, well below the sector's reputation. A high-retention SaaS platform with net revenue retention above 100 percent may trade at 15x or above. As Windsor Drake has observed, a 5.0x multiple may be excellent for a construction company and below market for a SaaS business. The same number means entirely different things depending on the business beneath it.
GF Data reported average middle-market private equity multiples of 7.2x to 7.5x across all deal types in 2025; technology-heavy transactions pull that figure above the Canadian SME baseline. For Canadian sellers specifically, the technology sector's lead position in domestic deal count means more active buyers than most sectors face, partially offsetting the Canadian discount. Smaller IT, managed service provider, and cybersecurity businesses continued to command strong multiples through 2024, even as aggregate deal flow decelerated from the 2021 to 2022 peak driven by private equity and venture capital activity.
Manufacturing: A Sector Split Between Commodity Producers and Engineered-Product Specialists
The headline range for private Canadian manufacturing spans roughly 6x to 8x for small to mid-sized companies, but that range conceals a distribution that is almost bimodal. DealStats private company transaction data shows the 25th percentile at 3.2x, the median at 5.4x, and the 75th percentile at 10.4x. A spread from 3x to 10x within a single sector reflects something more structural than deal-by-deal negotiation variation.
The divide is between asset-heavy commodity manufacturers and engineered-product specialists. Commodity producers, those selling undifferentiated product into price-competitive markets, attract multiples in the 5x to 7x range. High capital intensity, limited pricing power, and minimal customer switching costs all compress valuation. Engineered-product specialists with proprietary intellectual property, long customer qualification cycles, and specifications written into client engineering documents occupy a different market entirely: 9x to 12x is defensible when switching costs are genuine and recurring business is nearly guaranteed.
Capstone Partners data covering H1 2024 to H1 2025 showed manufacturing multiples climb from 10.2x to 11.1x at the platform level, driven by reshoring trends, supply chain diversification, and defense spending. That figure reflects larger institutional transactions, not the typical Canadian SME, but the directional signal matters: buyers are actively competing for the right manufacturing assets.
Advanced technologies, including modular production, automation integration, and precision-engineered components, are pushing previously commodity operations toward specialist multiples. For a Canadian manufacturing seller, the diagnostic question is not "what do manufacturers trade at?" but "which half of this market does my business resemble to a buyer who has seen both?"
Healthcare and Dental: Platform Transactions at Premium Multiples, Independent Practices Priced Differently
Healthcare services multiples have been in flux. The sector-wide median reached approximately 14.5x in 2024 before retreating to roughly 11.5x in 2025, reflecting higher borrowing costs and increased buyer selectivity after the 2021 to 2022 acquisition peak. The Canadian benchmark transaction for the sector is instructive: dentalcorp Holdings, traded on the TSX as DNTL, was taken private by GTCR in a deal valued at approximately C$3.3 billion enterprise value and C$2.2 billion equity. With last-twelve-month adjusted EBITDA of approximately $215 million USD at the time of the September 2025 transaction, the implied multiple was roughly 11x. That figure is the institutional ceiling for systematized, multi-location dental platforms.
The gap between that ceiling and where independent practices actually transact is wide and matters enormously for Canadian practitioners making exit plans. Larger platform-style practices with multiple locations and systematized operations, the type attractive to dental service organizations, typically trade at 9x to 11x EBITDA. Smaller add-on practices transact at 5x to 8x. An independent solo dental practice in Canada, per DentX, typically prices at roughly 60 to 85 percent of annual collections, or 1.5x to 2.5x SDE or EBITDA. Larger independent practices that a DSO might find attractive without the practice being a full platform transaction land in the 3.0x to 5.5x range.
The structural distinction is between a lifestyle transaction and an institutional one. The dentalcorp deal is not a comparator for most Canadian practitioners; it is a ceiling that defines what the category can become after years of aggregation, systematization, and professional management. For most independent practitioners, the relevant benchmark is the practice-level figure, and the gap is not marginal.
Construction, Trades, and HVAC: Why Recurring Revenue Is Worth More Than Extra Revenue
Construction occupies the floor of the multiple spectrum covered here, typically 4x to 6x, and the structural reasons are not difficult to identify. Revenue is largely non-recurring: every project must be re-won in a new competitive process. Working capital requirements are elevated. Bonding and insurance costs are significant. Large-project work creates customer concentration risk by design, since a single major contract can represent a disproportionate share of annual revenue.
The exception within construction is the firm holding long-term government or institutional maintenance contracts. Those contracts introduce genuine revenue predictability, and buyers pay for it. The constraint is customer concentration: dependency on a single government contract creates its own form of concentration risk, and buyers typically apply a discount when any single source approaches or exceeds roughly 40 percent of revenue. The contract premium is real, but fragile.
HVAC is the clearest case study for how recurring revenue directly drives multiple within a single trade. The same business, same EBITDA, producing 60 percent of its revenue from recurring maintenance agreements trades at 8x to 9x; the same business generating only 20 percent recurring revenue trades at 5x to 6x. The difference in enterprise value on that same level of EBITDA is tens of millions of dollars. HVAC multiples surged from late 2022 through the third quarter of 2024, representing one of the more significant multiple expansions across trades sectors in that period. Buyers recognized that maintenance agreements are as close to subscription revenue as the trades get.
The operational implication for a seller planning an exit two to three years out is direct: converting project revenue to service agreements is a multiple driver, not a revenue mix preference.
Professional Services, Staffing, and Engineering: How Contract Structure Determines Where in the Range You Land
Professional services is not a monolithic sector for valuation purposes. Recurring-model businesses, accounting firms, insurance agencies, IT managed service providers, command premium multiples relative to the broader services category. The asset-light structure, high margins, and predictable client retention that define these businesses are exactly the characteristics buyers prioritize. Staffing and recruiting firms serving enterprise clients typically transact around 6x, with revenue stability from ongoing client relationships lifting multiples above what a purely project-based services business would achieve.
Engineering firms tend to land lower, because project-based cash flow introduces the same forecasting uncertainty that depresses construction multiples. The exception is firms holding long-term government contracts, which introduces genuine revenue visibility. The qualification is identical to the one that applies in construction: customer concentration must remain manageable. A firm generating 50 percent of its revenue from a single federal contract is not a diversified professional services business; it is a single-contract dependency with professional staff attached. Buyers price that risk accordingly, and a single contract renewal event can reprice the firm significantly downward.
The through-line across every subcategory in professional services is this: what a buyer is purchasing is the certainty of future cash flow. Firms that can demonstrate that certainty through contract structure, client diversification, and operating systems that do not depend on the founder's continued presence command the higher end of their sector range. Firms that cannot sit at the lower end, regardless of current profitability.
Restaurants, Retail, and E-Commerce: Thin Margins, High Risk, and Where Franchise Structure Changes the Math
Independent single-location restaurants are among the lowest-multiple businesses in the private market, typically 1.5x to 3x SDE. The reasons are structural and cumulative: high failure rates, owner-dependent operations, no recurring revenue, thin margins, and low barriers to competitive entry. Multi-unit independent restaurant groups trade somewhat better, in the 2.5x to 4x SDE range, primarily because the operator has demonstrated replication capability.
Franchise structure changes the calculus materially. A single-unit franchise trades at 3x to 5x SDE; a multi-unit franchise with five or more locations, systematized and brand-supported, can reach 5x to 7x EBITDA. Restaurant franchise transactions across the category have shown median EBITDA multiples in the range of 3.82x to 4.17x. The systematization and brand infrastructure that franchisors provide reduce the replacement risk that depresses independent restaurant valuations, which is precisely why buyers pay for the structure even at a franchise royalty cost.
Restaurant multiples rose roughly 15 percent from pandemic lows in 2022 to 2023, leveled in 2024, and rose again in 2025. The businesses that survived the pandemic disruption are, on average, stronger operators than the pre-pandemic baseline, and multiples have partially reflected that.
E-commerce and retail face their own structural pressure. Niche specialists with defensible positioning achieve the strongest multiples within the category. Broad-category retailers face what buyers informally call "Amazon fear," the persistent concern that the category can be disrupted or undercut at scale, combined with supply chain cost volatility that compresses already thin margins. The seller's job in this sector is to demonstrate, with specificity, why their particular business is structurally insulated from the pressures that define the category.
What Determines Whether Your Business Trades at the Bottom, Middle, or Top of Its Sector Range
Every industry section above showed meaningful internal spread. The multiple is a starting point, not a destination, and the gap between the bottom and the top of a sector range can represent more enterprise value than the business's entire EBITDA.
Five factors consistently move a business toward the top of its sector range. Revenue quality is the first: recurring, contracted, or subscription-based revenue commands a premium over project or transactional revenue in every sector without exception. Customer diversification is the second: no single customer should represent more than 15 to 20 percent of revenue without a corresponding explanation of why that concentration is structural rather than accidental. Management depth is the third: buyers are not acquiring a business when the founder's departure represents a genuine operational risk; they are acquiring a dependency. Margin trajectory is the fourth: a business with improving margins at the time of sale tells a more compelling story than one with static or compressing margins, even if the current EBITDA figures are identical. Growth narrative is the fifth: buyers pay for future cash flow, not historical earnings, and a business that can articulate a credible, evidence-supported path to higher earnings commands a higher multiple than one that cannot.
None of these factors are fixed. Owner-operators with a two-to-three-year runway before a planned exit can move each of them meaningfully. Converting project revenue to service agreements, reducing customer concentration by diversifying the client base, building a management layer that operates independently of the founder, and systematizing operations so that the business's value is embedded in its processes rather than its people: these are not abstract strategic recommendations. They are direct levers on the enterprise value calculation.
Understanding where your business sits within the baseline, and why, is the foundational step in any realistic exit planning process. Independent advisors, M&A brokers with Canadian lower-middle-market experience, and business valuators accredited through the CBV Institute are all credible resources for this work.
The multiple your business achieves is not simply a reflection of which sector it operates in. It is a reflection of how your specific business answers the questions every buyer is asking about the certainty and durability of the cash flow they are being asked to pay for.