Growth Rate Premium in Lower Middle Market Business Valuations
Documented growth rate is the most powerful multiple driver an owner can build before a sale.

The lower middle market runs from roughly $2 million in transaction value up to $50 million, a range widely cited across industry practitioners and intermediaries. One factor moves the multiple a buyer pays more than almost anything else a seller controls: growth rate, measured and documented over time, not promised in a forecast tab. This piece traces where baseline multiples sit right now, why growth earns a premium on top of them, and what an owner can actually do, years before a sale, to build a growth story that survives diligence instead of collapsing under it.
Before any of that, the earnings metric matters, and getting it wrong skews every multiple comparison that follows. Below roughly $2 million in earnings, buyers typically price off seller's discretionary earnings, or SDE, which assumes an owner-operator drawing a salary from the business. Above it, adjusted EBITDA becomes standard, because buyers are budgeting for a hired management team rather than assuming the seller stays on. That switch is not a technicality. An SDE buyer is pricing a job replacement. An EBITDA buyer is pricing a platform, and the two discount growth differently as a result. Treat that distinction as scaffolding for everything below, not a footnote to skim past.
What baseline multiples actually look like across the LMM size tiers in 2024–2025
Ask four data providers what the average LMM multiple is right now and expect four different answers. Not because anyone is wrong, but because each is measuring a different slice of the market. DealStats tracks all private transactions, including asset sales, and put the median at 3.5x EBITDA in the fourth quarter of 2025. GF Data, which covers sponsored deals from $10 million to $500 million in transaction value, reported 7.2x across 2024. The gap between those two numbers is not a rounding error, it is a definitional one: different deal populations, different capital structures, different buyers entirely.
The more useful exercise is watching how multiples move within a single dataset as company size increases, because that gradient is where the real signal lives, not in whichever headline average gets quoted at a conference.
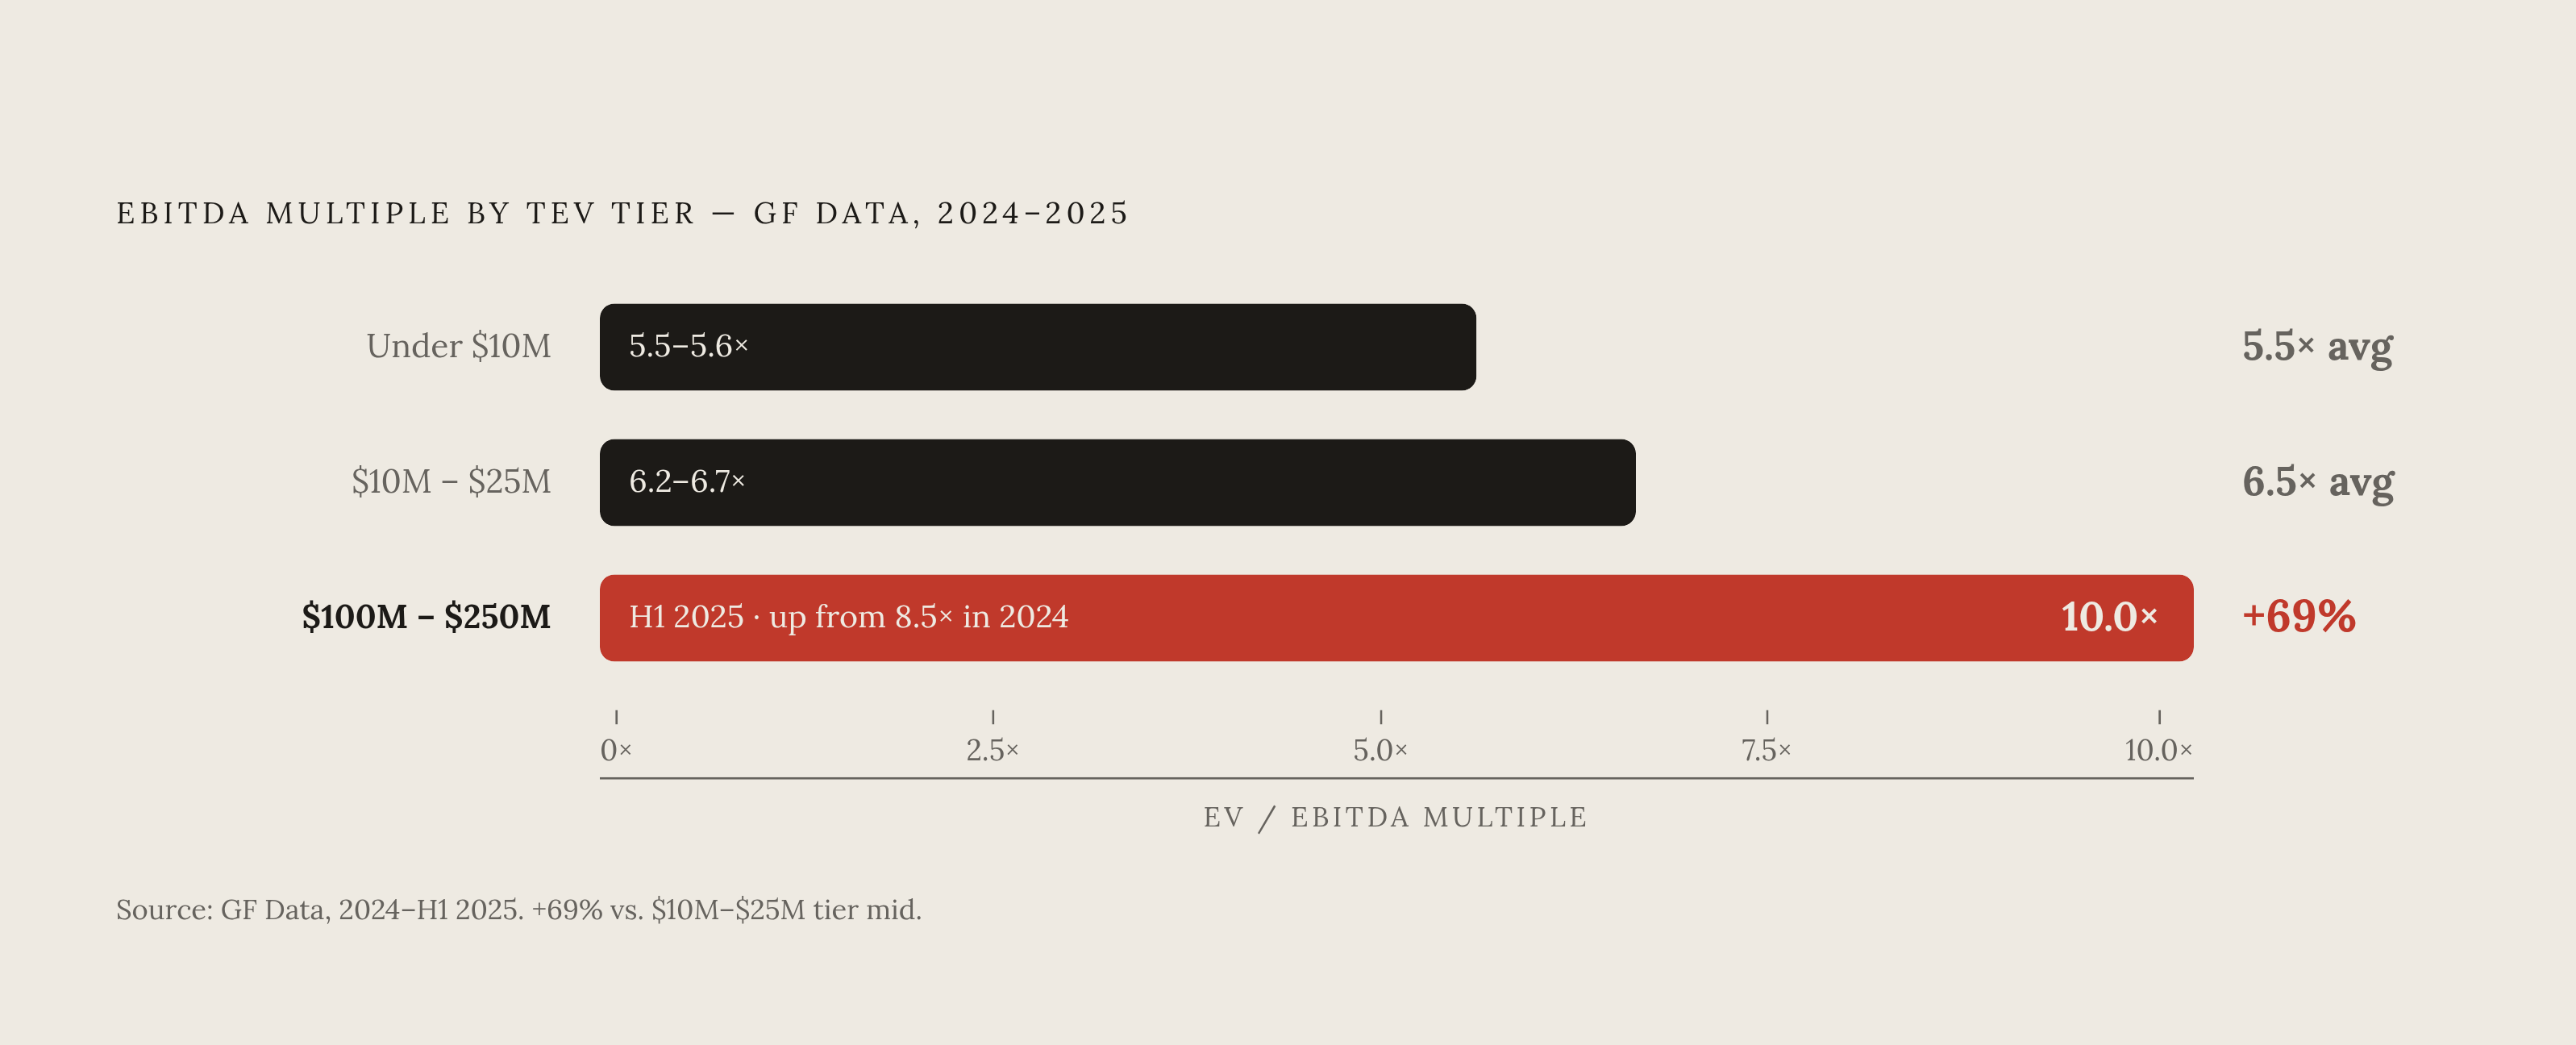
GF Data's tier breakdown for the first three quarters of 2024 shows that gradient clearly. Companies with $1 million to $10 million in total enterprise value averaged 5.5x, the $10 million to $25 million tier averaged 6.4x, and the blended average across all deals from $1 million to $500 million landed at 7.1x. By the first half of 2025, GF Data refined those numbers further. Under $10 million TEV sat around 5.5x to 5.6x, the $10 million to $25 million tier moved to 6.2x to 6.7x, and the $100 million to $250 million tier jumped to 10.0x, up sharply from 8.5x in 2024.
Put two of those figures side by side and the size gradient stops being abstract. A platform in the $100 million to $250 million range, at 10.0x, costs roughly 69% more per dollar of EBITDA than a platform in the $10 million to $25 million range at 5.9x. That is a structurally different price for the same dollar of earnings, driven by size alone, and any owner who skips past that fact is setting up for a bad surprise later.
Financial media loves to quote private equity multiples from headline buyouts, the billion-dollar transactions that dominate deal-of-the-year lists, and those numbers describe a different universe entirely. A business generating $3 million in EBITDA is not going to trade at the multiple a $300 million platform commands, full stop. Anchoring expectations on the wrong tier before a process starts is the single most avoidable mistake a seller makes, and it costs nothing but a few hours of reading the right dataset to avoid it.
Why growth rate earns a direct premium above the baseline multiple
Eight factors move an LMM multiple within its range: EBITDA quality, how much revenue is recurring versus one-off, growth rate, customer concentration, management depth, sector, deal size, and how many buyers are competing for the deal. Of those eight, growth rate is the one an owner can actually engineer over a two or three year runway, rather than something baked in by industry or history. That is what makes it worth isolating from the other seven.
Forvis Mazars stated in its December 2024 analysis that companies performing well in predictable or high-growth industries "typically garner premium valuations, often several turns above industry averages." Several turns, not a decimal point of adjustment. On a $2 million EBITDA business, that is the difference between a $10 million sale and a $16 million one.
Why does trailing growth move the needle this hard? A buyer is not purchasing last year's EBITDA snapshot. A buyer is purchasing a trajectory, and the most recent twelve to thirty-six months of actual performance is the best evidence available that the trajectory is real rather than a one-time bump that happened to land in the trailing period.
Recurring revenue acts as an amplifier on top of raw growth. A company converting transactional customers into multi-year contracts or subscription relationships is not just adding revenue, it is making that revenue defensible under diligence, which is exactly what a buyer's model needs before it justifies paying up. Management depth works from a different angle: a business that keeps growing without the founder personally closing every deal signals that growth survives the founder's exit. Its absence tends to be the single largest discount applied to companies at this size, because a buyer has no way to underwrite growth that lives entirely inside one person's contact list. That is worth sitting with, because it means the owner who works the hardest inside the business may be the one building the least sellable version of it.
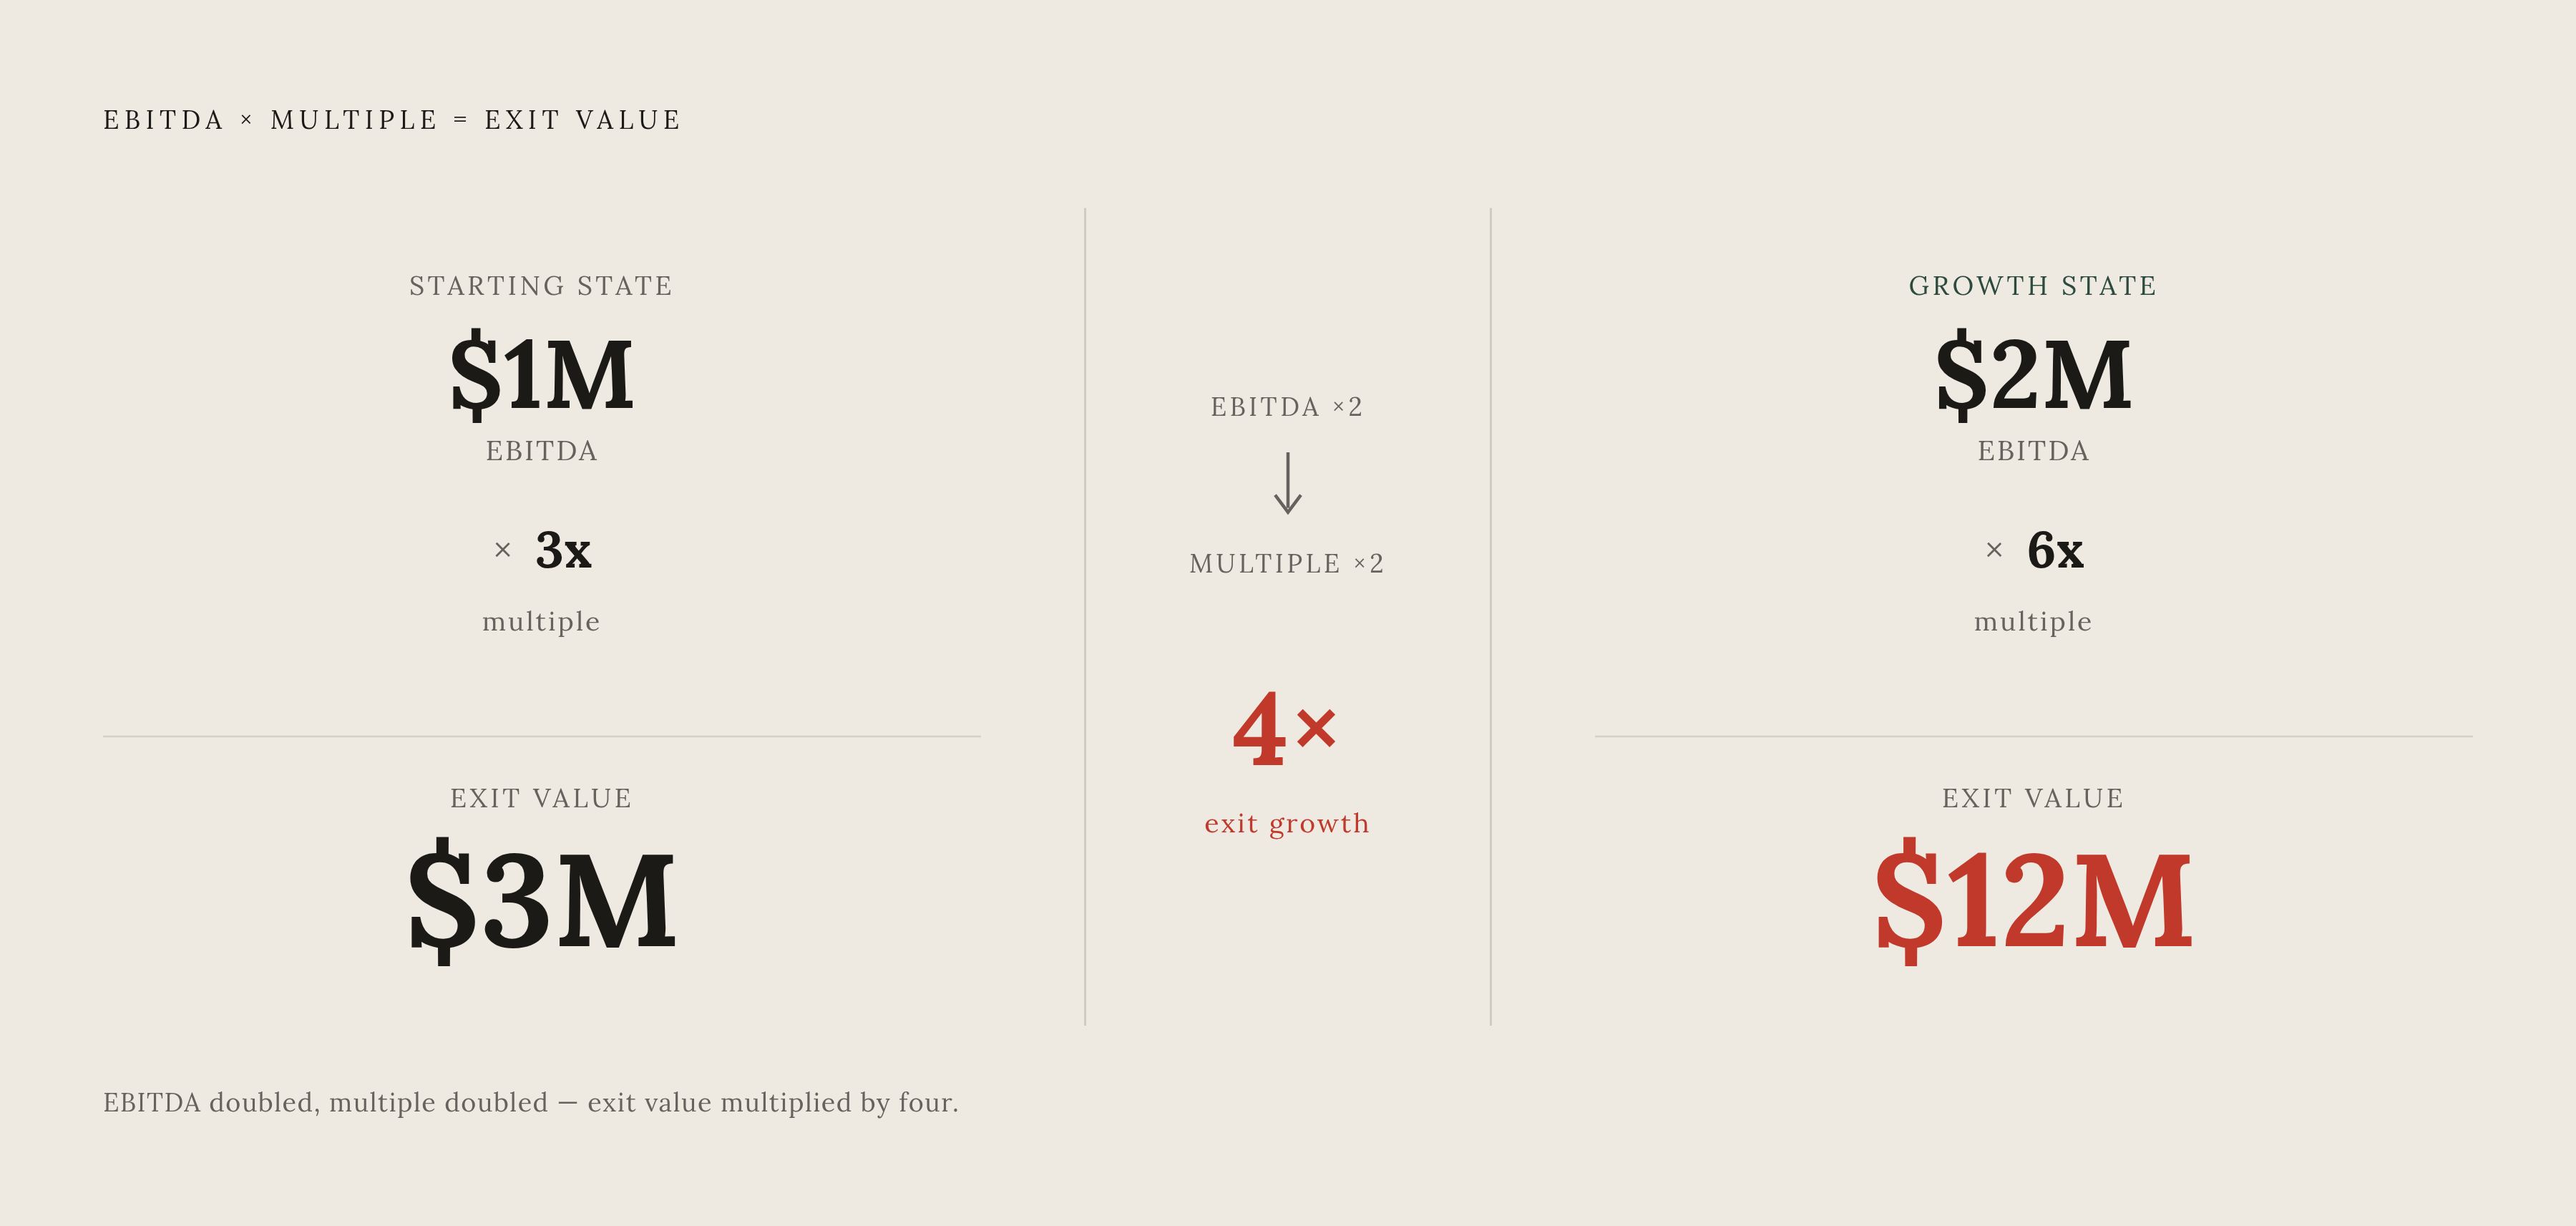
Here is where the compounding effect turns into real numbers. Take a business generating $1 million in EBITDA at a 3x multiple: that is a $3 million valuation. Grow EBITDA to $2 million and the multiple to 6x, and exit value hits $12 million. EBITDA only doubled. The exit price quadrupled, because growth raised both the earnings base and the multiple applied to it, at the same time. Every claim in this piece about growth earning a premium rests on that one mechanism: growth compounds multiplicatively, it does not just add up.
How DCF captures growth value when comparable multiples fall short
What happens when a business is growing so fast that no comparable transaction actually reflects its trajectory? Comparable multiples assume the target looks roughly like the deals used to build the comp set. A company growing at 25% a year, sitting next to a comp set built on businesses growing at 10%, is not well served by that method. This is where discounted cash flow analysis, or DCF, earns its keep.
DCF prices a business by forecasting future cash flows and discounting them back to a present value using a required rate of return, or WACC. Revenue growth rate is one of the model's most sensitive inputs: each 100 basis points added to the revenue growth assumption shifts the resulting valuation by roughly 3% to 8%. That swing, from a single input, is the clearest quantified evidence that growth rate itself, not just current earnings, carries a price.
Terminal value, the estimated worth of the business beyond the explicit forecast period, typically makes up 60% to 80% of total DCF value. So the long-run growth assumption baked into that terminal calculation is arguably the single most consequential number in the entire model, more consequential than next year's revenue line or this year's margin.
That sensitivity is also DCF's weakness as a pricing tool, and it is worth being blunt about this: DCF should not be trusted as the number that sets an LMM deal price. Small changes in WACC, growth assumption, or exit multiple can swing total value by 15% to 25%, which means a buyer and a seller can each construct a defensible DCF that supports whatever number they already wanted to hear, just by nudging one assumption a few points in either direction. That is exactly why DCF rarely sets the actual price in an LMM transaction. Buyers and sellers anchor on observable market multiples, and use DCF as a sanity check against that anchor, not as the primary mechanism.
The lesson underneath all this: documented, historical growth outweighs projected growth, because a buyer can discount a projection to zero if it chooses to. Three years of audited financials showing the same upward line is much harder to argue away than a forecast tab, no matter how carefully built.
The PE acquisition logic that makes growth rate worth paying for at acquisition
Private equity's interest in small, growing companies comes down to a mechanism called multiple arbitrage: the gap between the low multiple paid to acquire a small platform and the higher multiple that same platform commands at exit, once grown or combined with others. Growth rate is what closes that gap, and it forms the entire economic logic behind the buy-and-build strategy that dominates lower middle market private equity.
GF Data's numbers from the first three quarters of 2024 make the arbitrage concrete. Platforms valued between $1 million and $10 million averaged 4.5x EBITDA. Platforms between $10 million and $100 million averaged 6.5x. That is a two-full-turn gap: a sub-$10 million business that grows into the next tier gets automatically re-rated upward, independent of any change to the underlying business model. Keep climbing and the gap widens further. Platforms in the $100 million to $500 million range averaged 9x in that same period, a substantial further premium above the smaller tiers.
That arbitrage explains why roll-ups accounted for nearly 75% of sub-$10 million LMM deals in the first three quarters of 2024. Sponsors are buying fragmented, founder-owned markets piece by piece, consolidating them into a platform, and capturing the re-rating that comes with crossing size thresholds. A mature business sitting in a saturated market with no plausible growth path gets passed over entirely, or priced at the low end of its range, because there is no arbitrage left to capture. EBITDA alone does not underwrite the multiple. The growth thesis does, every time, and sellers who think a strong trailing EBITDA number alone is enough to draw a crowd are misreading what actually gets a room of buyers competing.
The returns data backs this up. Realized and partially realized lower middle market deals have produced a pooled 39% gross IRR since 2009, ahead of every larger private equity size band tracked. Sponsors have learned that growth potential in small companies tends to be underpriced relative to what it becomes once scaled, which is exactly why competition for good LMM targets keeps intensifying rather than easing off.
For a seller, the implication is straightforward: a PE buyer is acquiring a growth story built on top of a cash flow stream, not the cash flow stream alone. That should reframe which attributes get documented heading into a process, and which get treated as an afterthought.
The 2025 anomaly where size commanded the premium more than performance did
But what if growth quality, for a stretch, stops being the thing buyers pay the most for? That is roughly what happened across 2025, and it complicates the tidy story told so far without actually breaking it.
GF Data reported that companies with above-average financial performance received only a 2% pricing premium over other buyouts in 2025, 7.3x versus 7.1x. That is among the narrowest performance-to-valuation spreads GF Data has recorded. In a year when growth and quality should have separated winners from laggards more than ever, they barely separated them at all.
What happened instead: investors renewed their appetite for scale and creditworthy assets as lending conditions tightened. Lending conditions tightened, with lenders pulling back from smaller, riskier platforms and concentrating credit on larger, more established ones. The size spread widened as a result. The gap between sub-$100 million platforms and $100 million to $500 million platforms hit 2.8 turns in 2025, above the 2.6x long-term average. The $100 million to $250 million tier, recall, reached 10.0x in the first half of 2025, up from 8.5x in 2024, while tiers below $100 million held roughly flat.
One might argue this disproves the growth premium entirely. It does not, though it does reframe it. What emerged in 2025 was a bifurcated market, and the split matters more than the average. A-tier assets, meaning strong growth, recurring revenue, professional management already in place, still attracted record multiples and deep buyer competition. B-tier assets, meaning flat growth and heavy owner-dependence, faced compressed valuations and longer time to close. Growth quality did not stop mattering. It stopped being the thing that moved the market on average, and became instead the line separating who got a deal done quickly at a strong price from who did not get a deal done at all.
So the premium is cyclical in size but structural in direction. When credit tightens and scale becomes the scarce resource, size buys the headline premium. Growth and quality remain the floor condition underneath it: the thing that determines whether a business is even in the conversation, headline number or not.
How growth premium plays out differently across the main LMM sectors
Growth premium does not look the same walking into a healthcare deal as it does walking into a manufacturing one, and the sector data from the first half of 2025 makes that difference explicit. GF Data's highest LMM multiples by sector: healthcare at 8.3x, retail at 7.8x, business services at 7.5x, distribution at 7.0x, and manufacturing at 6.5x. Business services stood out further, trading a half-turn above its own long-term average in year-to-date 2025 figures, a sign buyer appetite has tilted toward services generally as goods-producing sectors navigate trade uncertainty.
Manufacturing tells a more granular story, worth slowing down on because it cuts against the assumption that fast growth is always the thing to chase. FOCUS Bankers reported in March 2026 that the typical LMM manufacturing range runs 5x to 8x adjusted EBITDA, and the quality premium within that range is widening rather than narrowing. Precision manufacturers occupying defensible niches, with diversified customer bases and stable margins, land in the top quartile of that range. Commodity manufacturers, or businesses exposed to sharp cyclicality, trade at or below the low end regardless of current growth rate: a fast growth number does not save a business whose growth could vanish with one customer's decision to reshore. The lesson for a manufacturing owner is that documented operational discipline and a diversified customer list move a business from the median of its range to the top quartile, and growth prospects only carry weight if that growth looks defensible rather than lucky.
Software tells yet another story. Private SaaS valuations for companies in this size range have settled at 4.0x to 5.5x ARR, and companies with genuine AI functionality, not a feature bolted on for a pitch deck, command 30% to 50% premiums over comparable non-AI software businesses. The Rule of 40, which adds revenue growth rate to EBITDA margin and looks for a combined score at or above 40, functions as the sector's shorthand for growth quality. Companies clearing that bar consistently trade at multiples roughly two to three times higher than companies falling short of it.
Zoom out across sectors and one mechanism holds steady even as the magnitude shifts: buyers pay for demonstrated upward trajectory in industries where that trajectory is believable and hard to reverse, not simply for the highest growth percentage on the page. The broader midmarket confirms the same size gradient discussed earlier. PowerComps and TagniFi data show median total EV/EBITDA across the middle market rising to 9.2x for the trailing twelve months ended March 31, 2026, up from 8.4x in 2024, with the largest gains concentrated in bigger deals: the $200 million to $500 million segment moved from 9.6x to 11.4x, and the $500 million to $999 million segment moved from 10.1x to 12.0x. LMM transactions, by comparison, showed far more modest movement, reinforcing that size, not just sector, keeps shaping where the growth premium lands hardest.
What sellers in the $500K–$50M revenue range can do to build a documentable growth premium before going to market
Everything above points toward one operating principle: buyers pay for trailing growth, not projected growth. So the highest-leverage move available to an owner is entering a sale process with a clean, multi-year record of revenue and earnings momentum already documented, not promised, and not still sitting in a spreadsheet marked "projected."
Recurring revenue is the first lever, and one of the few that raises the multiple before EBITDA even moves. Converting transactional customers into contracts, subscriptions, or retainer relationships does not just add stability. It makes the growth story defensible under buyer diligence, which is exactly where growth narratives usually fall apart under questioning.
Management depth is the second lever, and arguably the one owners underestimate the most. A business where growth depends on the founder personally showing up every day gets discounted hard in the lower middle market, because a buyer cannot underwrite growth tied to one irreplaceable person. Documenting that a team, not just the owner, drives new business and retains existing accounts is one of the most direct ways to close that discount before a buyer ever raises it. Skip this step and no amount of trailing growth on the P&L will fully offset it.
Customer concentration undercuts the growth story even when the headline growth number looks strong. A business growing 20% a year off two accounts is not showing durable growth. It is showing exposure, and any buyer's diligence team will price that exposure the moment it sees the customer list. Diversifying the customer base ahead of a sale protects the multiple even if it slightly slows near-term revenue growth in the process, and that tradeoff is almost always worth making.
Timing matters more than most owners expect. Entering a sale process on an upward trajectory, meaning the trailing twelve months outperforming the prior year, captures the premium discussed throughout this piece. Entering on a flat or declining year inverts it, and no amount of storytelling in a pitch deck fully offsets a down year sitting in the financials a buyer's diligence team will find regardless of how the deck frames it.
Cornerstone Business Services reported that its 2024 engagements averaged 10 indications of interest per client, up from four to five in 2022 and 2023. Fewer well-prepared sellers are coming to market, which means a business with documented growth faces less competition for buyer attention and, at the same time, more competition among the buyers bidding for it. That is a favorable position to be in, and it rewards preparation that started years, not months, before the process.
None of these levers, recurring revenue, management depth, customer diversification, show up in financials overnight. They take two to three years to compound into something a buyer's diligence team can actually verify. Whatever the planning horizon, three years out or closer, the growth premium traced across multiples, DCF sensitivity, PE arbitrage, and sector data all comes back to the same requirement: a documented trajectory, not a projected one, is what a buyer is actually willing to pay for.
Sources
- Q3 2024 Middle-Market M&A Insights | Forvis Mazars US
- Small Deals Big Factor in Middle-Market Private Equity in 2024
- Valuation Trends in Lower Middle Market Manufacturing M&A | FOCUS
- Middle Market Commentary – 1H 2025
- 2025 M&A Outlook: Lower Middle Market Poised for Active Year | Cornerstone Business Services
- Lower Middle Market Private Equity Market Analysis | 2026 Statistics
- Lower Middle Market Private Equity: Size, Buyers, Multiples
- quantpillar.com