Deal Flow Velocity Metrics That Predict a Successful Exit
Three metrics reveal whether your deal is stalling or moving toward exit.

Deal flow velocity is just how fast a deal moves from first buyer contact to signed close. I've come to trust its pace more than I trust a founder's gut feeling about "how things are going," and that gut feeling is wrong more often than you'd think, not because founders read their own business badly, but because they're standing too close to see the stall coming.
Most owners going through a sale experience it as long stretches of waiting broken up by odd bursts of activity. A call, a document request, then three weeks of nothing. Without something to measure that quiet against, you can't tell if it's normal or the first crack in the foundation.
Separate input metrics from output metrics before anything else. Inputs are activity: emails sent, meetings booked, diligence questions fielded. Outputs are results: offers received, multiples achieved, deals closed. Velocity lives in between, measuring how efficiently one turns into the other over time. A process can look busy, ten buyer calls scheduled in a month, data room logins climbing, follow-up questions rolling in, while stalling underneath, because none of that motion converts into a next stage. Founders often feel great about a month like that, right up until they notice none of the ten buyers actually moved forward.
Three signals carry the weight of what follows: buyer response rate, time-in-stage ratios, and offer conversion speed.
Buyer response rate as the first signal a deal is gaining or losing momentum
Buyer response rate is the share of qualified buyers who engage in a way that means something. Signing an NDA, joining a management call, asking a question that goes past the surface of the CIM. It sits upstream of everything else, which is exactly why it deserves the first look; weak response at the top compresses everything below it before the deal ever gets a chance to build real tension among buyers.
Affinity looked at 291 private equity firms and found a striking gap in outreach efficiency: the best firms landed one introduction for every 11 emails sent, while the worst needed 185 for the same result. Seventeen times the effort for the same outcome. It wasn't about hustle. It came down to who got contacted and how the pitch was framed.
So here's an uncomfortable question for any founder watching their advisor's early numbers come in slow. Is that bad luck, or is the buyer list itself off? Usually it's the list, built without enough precision, or aimed at buyers who were never quite the right fit to begin with. A founder can't see raw email counts the way a firm-level study can, but there's a workable proxy sitting right in front of them: track buyers contacted against NDAs signed, then watch how many NDA signers actually show up for the management presentation. Each drop-off names, almost literally, where the stall lives.
Positioning matters here too, separate from raw volume. A business well-framed inside a sector buyers are actively hunting draws inbound interest almost regardless of who's doing the outreach. A business poorly presented, even with solid numbers underneath, can go quiet even in a hot market. Harvard Business School research on venture capital found that nearly 70% of VC deals originate from investor networks rather than cold outreach. The M&A parallel isn't a stretch: buyers who arrive through a warm intro tend to move faster and drop out less, because some of the trust-building already happened before the first call.
Time-in-stage ratios and what they reveal about where a deal is actually stalling
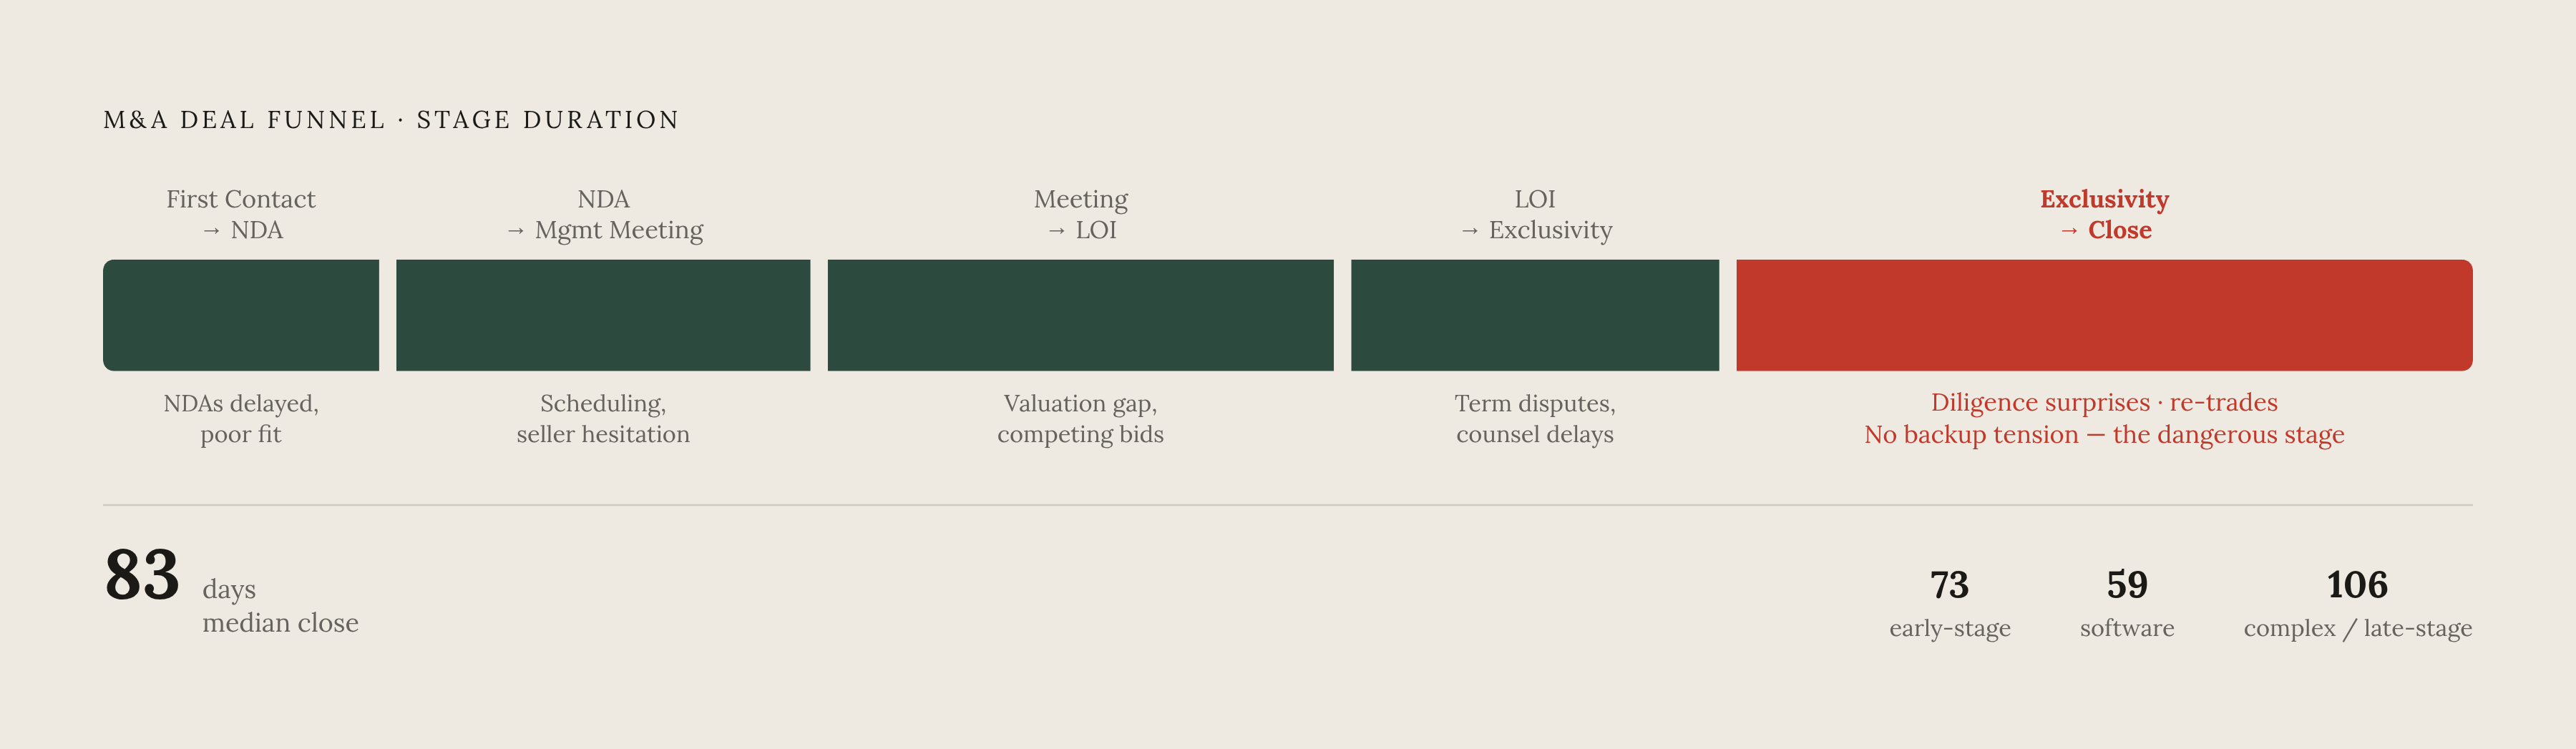
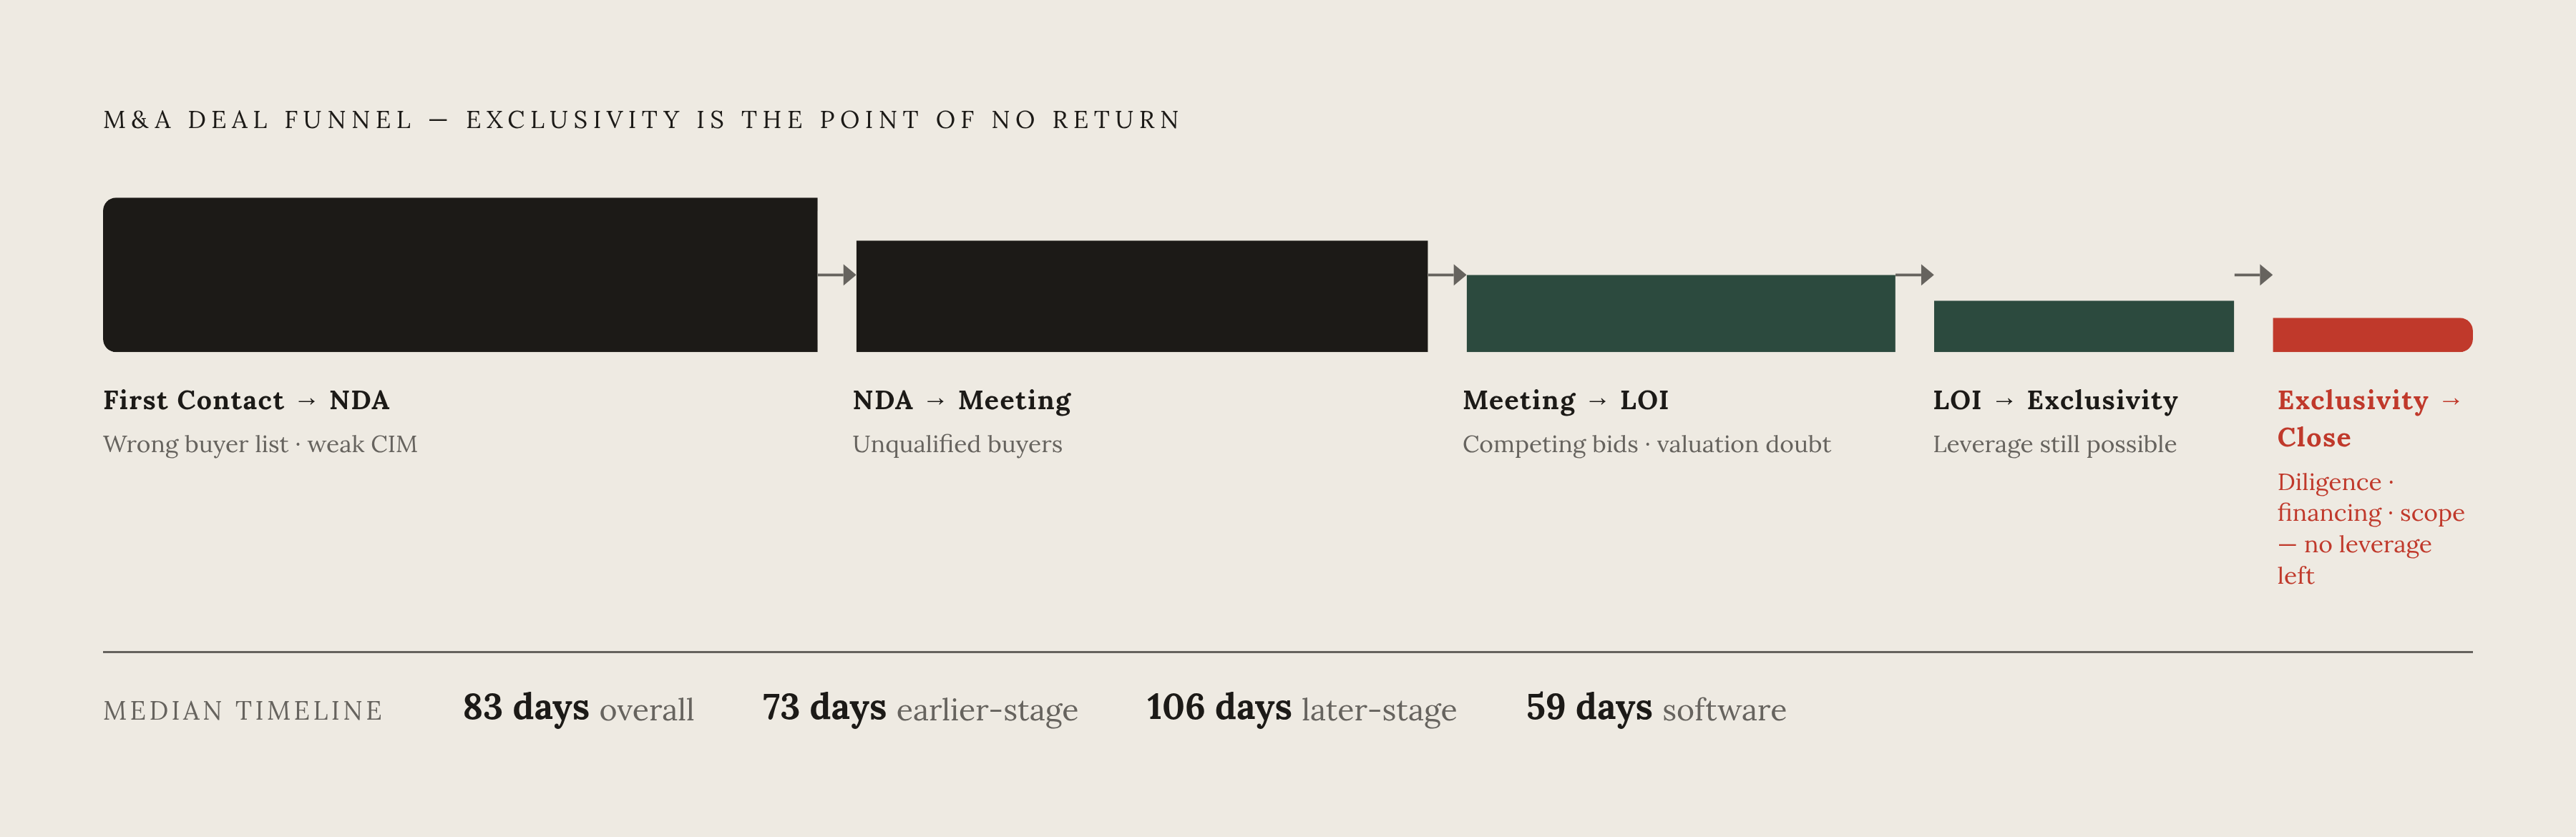
Average close time, as one headline figure, hides more than it shows. It flattens every stage into a single number, so two deals with identical overall timelines can be fighting completely different problems underneath the surface.
Break it apart instead: first contact to NDA, NDA to management meeting, meeting to LOI, LOI to exclusivity, exclusivity to close. Industry data puts the median time from first consideration to signed agreement around 83 days overall, with earlier-stage deals closing faster, near 73 days, and more complex or later-stage deals stretching to around 106. Software deals tend to move quicker still, closing around 59 days, mostly because the financials are cleaner and diligence is more standardized across similar companies.
Those benchmarks tell you whether your overall timeline sits inside a normal range. They don't tell you which stage is actually broken, though, and that distinction matters more than people give it credit for. A 90-day process that burned 60 days between LOI and close has a fundamentally different problem than one that burned 60 days just getting to LOI. Compare each stage's actual duration against its expected benchmark, and look for the one running two or three times over.
Different stages stall for different reasons. At NDA-to-meeting, a stall usually means the buyer isn't qualified enough, or the CIM isn't answering what actually matters to them. At LOI-to-exclusivity, it often means competing bids are being used as leverage, or the buyer has valuation doubts they haven't worked through yet. The exclusivity-to-close stage is the dangerous one: diligence surprises, financing delays, and scope creep tend to surface right here, and by now the seller has usually stopped talking to other buyers. No backup tension left to lean on.
Diligence intensity drives a lot of this on its own. Venture capital data show firms averaging 118 hours per deal in diligence, with the more complex deals reaching 184. The M&A version holds the same shape: buyers with more at stake, bigger checks, deeper integration plans, run longer and heavier diligence no matter how clean the data room looks. A well-organized data room doesn't make diligence disappear. It just keeps the stage from turning into a fishing expedition where every document request spawns three more behind it.
How offer conversion speed predicts whether competitive tension is real or theatrical
Offer conversion speed measures the gap between a buyer finishing the CIM, or wrapping a management meeting, and actually submitting an IOI or LOI. Of the three signals here, this one comes closest to predicting the outcome directly.
Why does that gap matter so much? A buyer who moves fast to an offer is showing conviction; they've seen enough, and they don't want to lose the deal to someone else. A buyer who lingers is usually doing one of a few things: running a parallel process on another target, waiting to see who else drops out before committing resources, or quietly anchoring toward a lower number by letting time do the negotiating for them.
This is where competitive tension gets tested for real. In a well-run process, multiple IOIs land inside a defined window, clustered rather than trickling in one at a time, and that clustering is the actual mechanism pushing price toward the ceiling instead of the floor. When IOIs show up slowly and one at a time instead, the seller bleeds leverage even if the eventual number looks fine on paper. Worst case of all: a single buyer in exclusivity who arrived slowly to begin with. Nothing checks their diligence behavior, and nothing stops a re-trade later, because no other buyer is waiting in the wings.
A fast offer conversion rate reflects three things working together: buyer list quality, process design (deadlines that get set and actually get enforced), and how clearly the business tells its own story. All three of these get built before a process launches. Luck has very little to do with it.
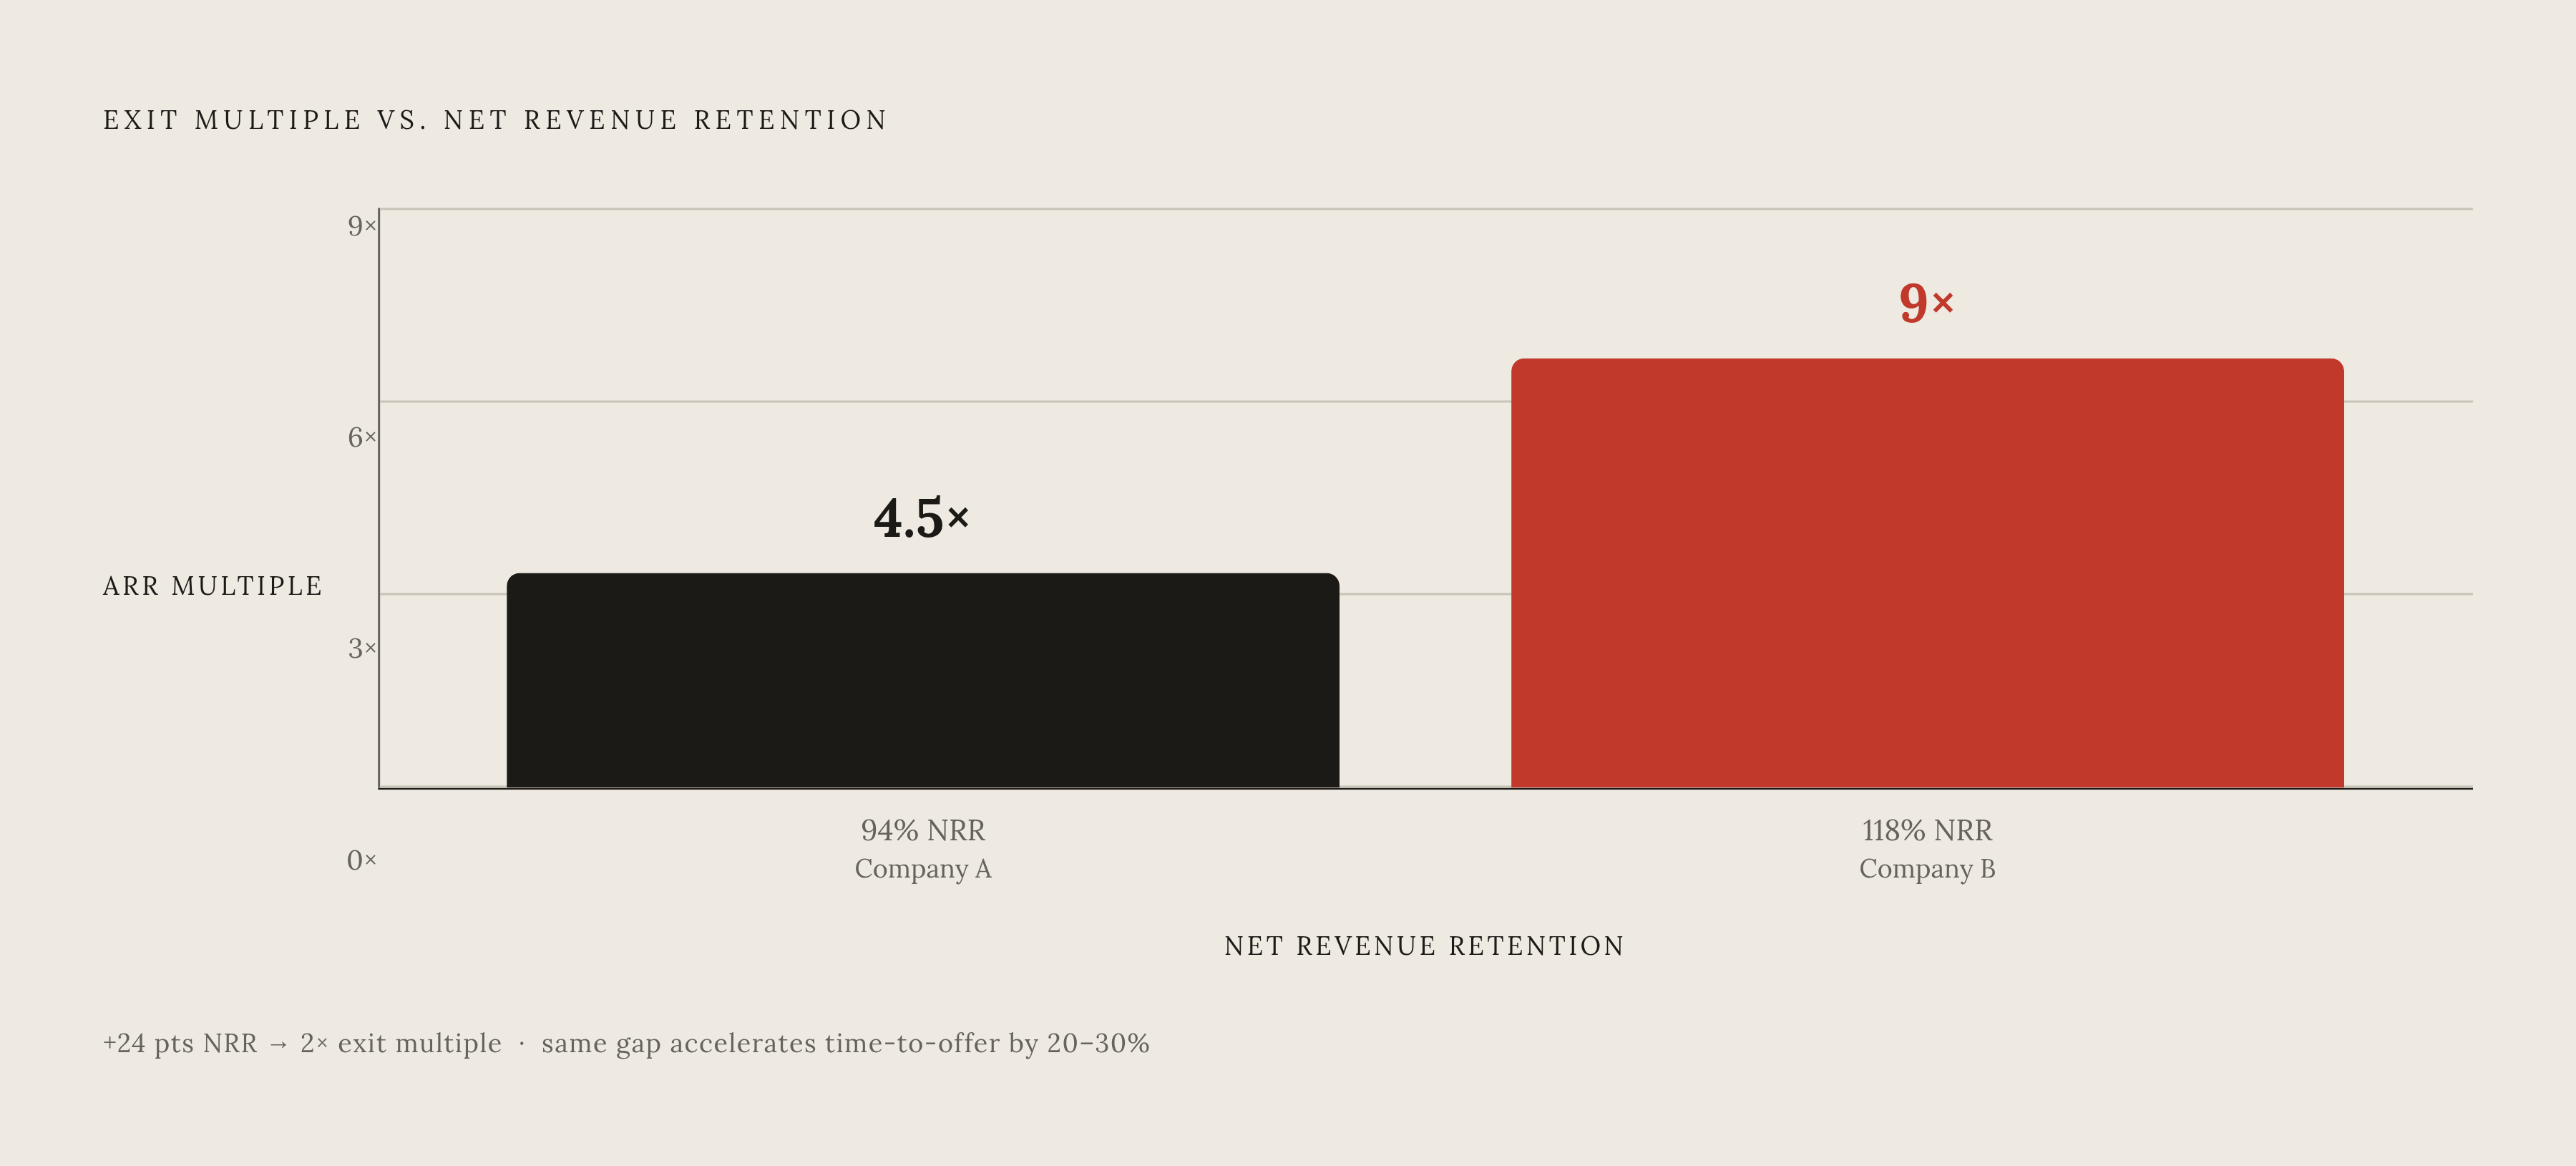
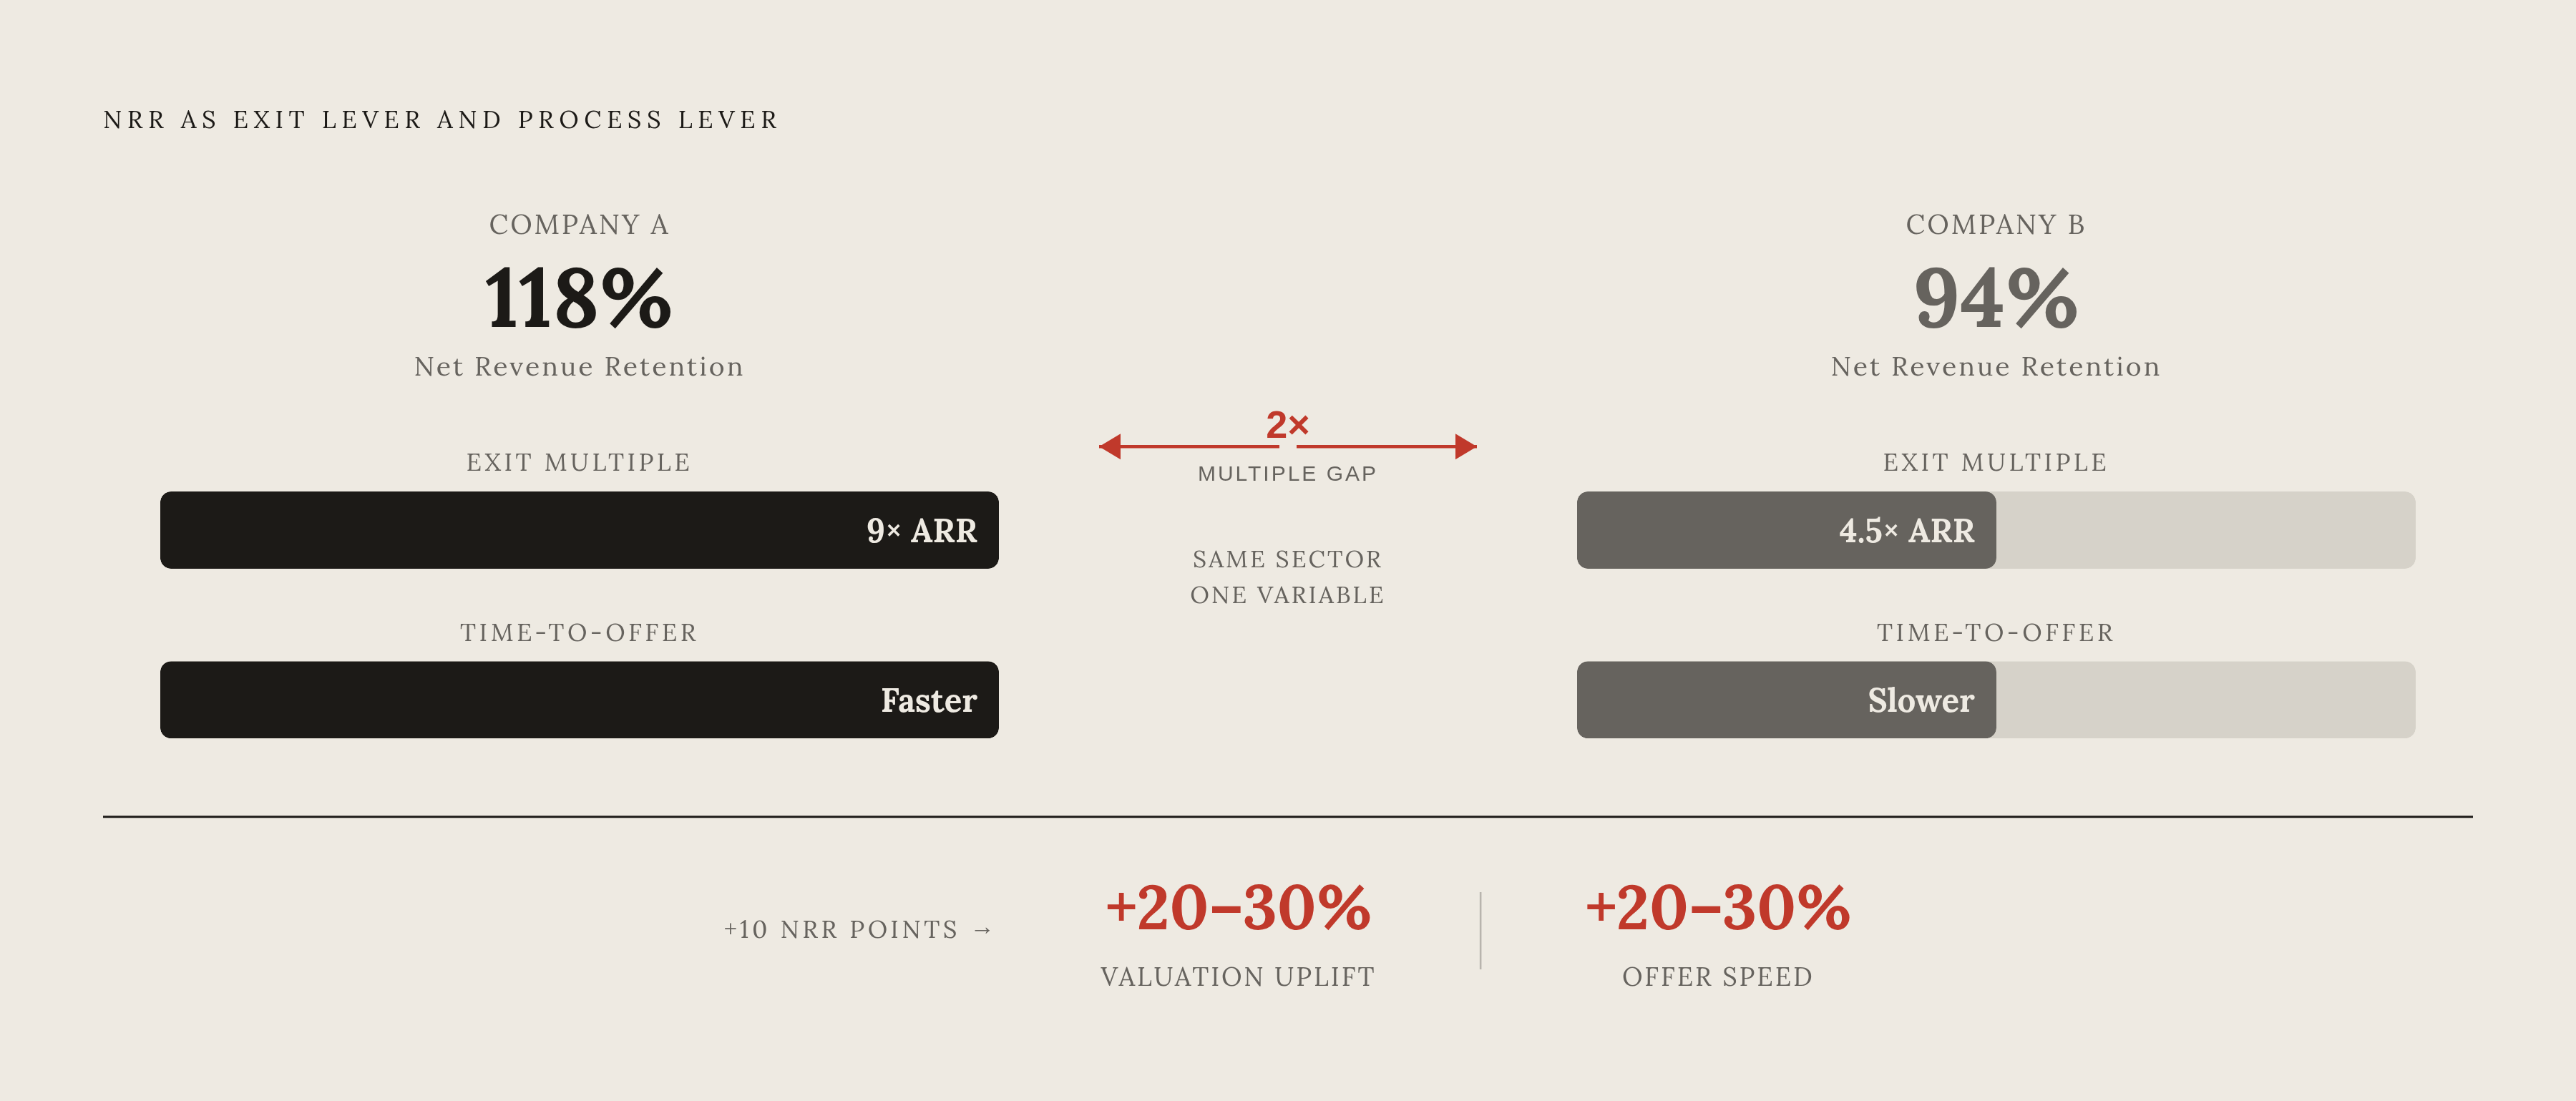
For SaaS and recurring-revenue businesses, net revenue retention makes the case cleanly. Comparable SaaS companies with 118% NRR have commanded roughly 9x ARR at exit, against 4.5x ARR for otherwise similar companies running 94% NRR. Metric quality doesn't just move valuation; it accelerates buyer conviction, and that acceleration shows up directly in how fast the offer lands. The same dynamic plays out in non-SaaS businesses under different names: customer concentration, contract tenure, repeat revenue, all shaping how fast a buyer goes from interested to committed.
Offer conversion speed doubles as an early warning system after LOI, too. A buyer who moved fast to LOI and then suddenly slows in diligence is often sitting on something they plan to use for a re-trade. Catching that early gives a seller time to quietly re-engage backup buyers before exclusivity locks the door shut.
The business metrics that accelerate or brake all three velocity signals simultaneously
Buyer response rate, time-in-stage, and offer conversion speed don't move independently. All three respond to the same underlying quality signals coming out of the business itself, and a business that scores well on the metrics buyers actually care about shortens every stage of the funnel at once, not just one of them.
Net revenue retention matters most for recurring-revenue businesses, probably more than most founders expect going in. High Alpha's 2024 SaaS Benchmarks Report found companies with high NRR growing roughly 2.5 times faster than their low-NRR counterparts, and buyers price that compounding effect into both what they offer and how fast they offer it. Benchmarkit data shows median NRR slipping from 105% in 2021 to 101% in 2024, which means simply holding above 100% today counts as above-median. A 10-point improvement in NRR can translate into a 20 to 30% uplift in valuation, and that same 10 points is also a 20 to 30% improvement in the exact signal that speeds up time-to-offer.
Growth rate works the same way. KeyBanc's 2024 survey found private SaaS companies running median ARR growth of 19 to 21%, with the top quartile reaching 27 to 32%. Buyers pattern-match against these numbers almost the moment they open the CIM. Growth below them doesn't just lower price; it stretches out time-to-offer, because buyers want more diligence before they'll commit to anything.
Churn is the most visible brake of them all. Two SaaS companies with nearly identical ARR and nearly identical growth rates closed at 9x and 4.5x respectively, and the entire gap traced to one variable: logo churn at a low rate annually versus a much higher one, alongside that same NRR split of 118% versus a significantly lower figure. One metric cut the price in half and slowed the whole process down with it, same variable, two different symptoms.
Founder-led businesses outside SaaS have their own version of these levers. Customer concentration is the clearest one; a single customer above a certain share of revenue drags out every stage, because every buyer wants to understand that risk before moving forward. Contract tenure and renewal rates matter in similar ways. Owner-dependency might be the most underrated of all: businesses where the founder personally is the key relationship tend to stall hardest right at the management meeting, the exact moment buyers realize how much value walks out the door with one person.
Timing ties all of this together, and this is the part that's easy to miss. These are metrics shaped by decisions made months, sometimes years, before a sale process ever launches. The velocity framework only pays off if it's applied early enough to still act on.
How holding period interacts with velocity, and why timing the exit matters as much as running it well
Average private equity hold periods have stretched considerably in recent years, with observers noting that median durations have grown meaningfully over the past decade. That figure matters to founders in a roundabout way: it means the buyers across the table are themselves under pressure to deploy capital and exit on timelines that have gotten tighter, not looser, even as the holds themselves lengthen.
The timing of an exit relative to a business's growth trajectory shapes buyer conviction in ways that are easy to underestimate. Too early, and there isn't enough information yet for a buyer to feel real conviction about the business's potential. Too late, and the window's already closing, because the story has matured past peak buyer interest. Neither extreme does the seller any favors.
The practical implication is straightforward: timely exit maximizes returns, while holding too long lowers the odds of a successful outcome even when the business underneath is still perfectly healthy. Translated for a founder: a business that's already passed its growth inflection point, but hasn't drifted into a plateau yet, gets the fastest, highest-conviction response from buyers. Wait for "one more year of growth" past that inflection, and the process that follows tends to run slower and get scrutinized harder, because time-in-stage ratios stretch as buyers start modeling deceleration risk straight into their diligence.
Style drift adds another wrinkle worth knowing about. A business that has drifted away from its original positioning or model tends to be harder to categorize than it used to be, and that ambiguity slows down every stage of buyer evaluation, because buyers spend extra time just figuring out what they're looking at before they can commit to anything.
Founder-led businesses doing somewhere in the lower-to-mid millions in revenue sit inside a window that seems to matter more than most people give it credit for. That range often lands right at the inflection point where velocity metrics run most favorably: established enough that buyers trust the numbers and commit with conviction, early enough that the growth story hasn't gone stale yet.
Reading your own deal's velocity in real time and knowing when to intervene
Treat the process as a pipeline with stage-level data attached, not a single long event you simply wait out. Owners tracking time-in-stage weekly get the chance to step in before a stall turns into something closer to collapse.
Three questions matter at every stage. On buyer response: how many NDAs are signed against how many buyers were contacted, and does that ratio look like a genuinely competitive process or something thinner? On time-in-stage: how long has the current stage actually run, and what's the benchmark for a deal like this one? A stage running meaningfully over benchmark is a flag, not a delay to shrug off as normal. On offer conversion: are IOIs landing inside the window the process set, or is the timeline drifting with no stated reason? Single-buyer situations, especially ones where that one buyer arrived slowly to begin with, deserve the closest look of all.
When velocity drops, patience isn't the only option left on the table. Re-engaging buyers who signed an NDA and went quiet works better than most founders expect; a well-timed follow-up with updated information can wake up interest that looked dead. Bringing in new qualified buyers to rebuild competitive tension is another lever, though it gets a lot harder once exclusivity is signed, which is exactly why backup relationships need tending all the way through LOI, not dropped the moment the first offer lands. If the stall is happening at the very top, in response rate itself, revisit the CIM and the underlying positioning before blaming the business. Often the framing is the actual problem, not the fundamentals underneath it.
An experienced M&A advisor earns their fee here by tracking these ratios across many deals at once. That's what lets them tell a normal lull apart from a structural stall in a way a founder going through their first, and likely only, sale can't always manage alone. There's a real difference between an advisor who reports activity, meetings held, calls made, and one who reports velocity: response rates, time-in-stage ratios, offer conversion timing. That difference shows up in the final number, pretty much every time I've watched it play out.
Some of this is starting to shift upstream, too. AI-driven buyer matching, pairing sellers with buyers whose acquisition criteria, sector focus, and available capital genuinely line up before the process even launches, compresses time-to-NDA and time-to-offer from day one, rather than trying to claw back lost time once a process is already stalling. The velocity gain moves to the front of the process instead of getting chased after the fact. Whether that replaces the instinct of a seasoned advisor who's sat through two hundred of these deals is a different question, and one I don't think the data has fully answered yet.
Velocity metrics work best as planning inputs for founders sitting three months, or three years, out from a transaction, not only as diagnostic tools for a deal already underway. The operational decisions made now, this quarter, this year, are what determine which way those metrics point when the moment to sell actually arrives.